

If Iván caused $15 billion, then it's the 2nd costliest hurricane in USA history, now Charley goes to 3rd place. Right?
Also, the EPAC is already done!
Tropical Cyclone Reports for 2004 Atlantic season Thread
Moderator: S2k Moderators
Forum rules

The posts in this forum are NOT official forecasts and should not be used as such. They are just the opinion of the poster and may or may not be backed by sound meteorological data. They are NOT endorsed by any professional institution or STORM2K. For official information, please refer to products from the National Hurricane Center and National Weather Service.
-
AussieMark
- Category 5

- Posts: 5858
- Joined: Tue Sep 02, 2003 6:36 pm
- Location: near Sydney, Australia
-
Derek Ortt
-
AussieMark
- Category 5
- Posts: 5858
- Joined: Tue Sep 02, 2003 6:36 pm
- Location: near Sydney, Australia
-
Matt-hurricanewatcher

-
HurricaneBill
- Category 5
- Posts: 3420
- Joined: Sun Apr 11, 2004 5:51 pm
- Location: East Longmeadow, MA, USA
Derek Ortt wrote:there may be a resurvey of Charley as well.
Look for a revised copy of the Charley report (typically, these important storms, have multiple revisons issued) within the next few months
Yeah, Juan got revised earlier this year. They had originally said Juan was responsible for 2 direct fatalities. But they revised it, bumping the number of direct fatalities up to 4.
0 likes
-
Guest
Here is the revised Hurricane Charley MWHC best track. 160mph now at landfall at Punta Gorda. Intensity at captiva remains the same still at 160mph.
c. Best track for hurricane Charley
Date/Time
(UTC) Position Pressure
(mb) Wind Speed
(kt) Stage
Lat.
(°N) Lon.
(°W)
09 / 1200 11.4 59.2 1010 30 tropical depression
09 / 1800 11.7 61.1 1009 30 "
10 / 0000 12.2 63.2 1009 30 "
10 / 0600 12.9 65.3 1007 35 tropical storm
10 / 1200 13.8 67.6 1004 40 "
10 / 1800 14.9 69.8 1000 45 "
11 / 0000 15.6 71.8 999 55 "
11 / 0600 16.0 73.7 999 55 "
11 / 1200 16.3 75.4 995 60 "
11 / 1800 16.7 76.8 993 65 hurricane
12 / 0000 17.4 78.1 992 65 "
12 / 0600 18.2 79.3 988 75 "
12 / 1200 19.2 80.7 984 80 "
12 / 1800 20.5 81.6 980 90 "
13 / 0000 21.7 82.2 976 90 "
13 / 0600 23.0 82.6 966 105 "
13 / 1200 24.4 82.9 969 110 "
13 / 1400 24.9 82.8 965 115 "
13 / 1700 25.7 82.5 954 130 "
13 / 1800 26.1 82.4 947 140 "
14 / 0000 28.1 81.6 970 80 "
14 / 0600 30.1 80.8 993 75 "
14 / 1200 32.3 79.7 988 65 "
14 / 1800 34.5 78.1 1000 60 tropical storm
15 / 0000 36.9 75.9 1012 40 extratropical
15 / 0600 39.3 73.8 1014 35 "
15 / 1200 41.2 71.1 1018 30 "
15 / 1800 merged with front
13 / 0430 22.7 82.6 966 105 landfall on south coast ofCubanear Playa del Cajio
13 / 1945 26.6 82.2 941 140 landfall near Cayo Costa, FL, and minimum pressure
13 /2045 26.9 82.1 941 140 Landfall near Punta Gorda, FL
14 / 1400 33.0 79.4 992 70 landfall near Cape Romain, SC
14 / 1600 33.8 78.7 997 65 landfall near Myrtle Beach, SC
0 likes
-
Guest
Preliminary report
Hurricane Charley
Aug 9-15, 2004
Tom S
Midwest Hurricane Center
Updated Jan 11 2004
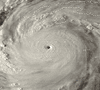
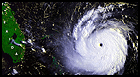
Hurricane Charley was a category five hurricane on the Saffir/Simpson hurricane scale that made landfall along Captiva Island in Southwest Florida on the Afternoon of August 13 and caused devestating damage in Charlotte County and surronding areas. Preliminary figures show damage to be at least 30 billion dollars along with estimated 25 fatalities.
a. History.
Charley formed from a westward moving tropical wave on August 9th about 100 miles east of the Winward Islands. Charley moved at a very fast speed to just south of Jamacia on the 11th as a hurricane and made landfall early on the 13th near Playa Del Cajio with sustained winds estimated at 120 mph. Charley weakend to a category two hurricane with sustained winds of 110mph while moving over western Cuba and moved over the Dry Tortugas while once again becoming a major hurricane. It's estimated around 11am eastern time Charley became a category 4 hurricane with sustained winds around 135mph. Over the next several hours leading to landfall Charley based on radar and satellite continued to rapidly intensify and around 3pm edt right before first landfall on Captiva Island it's estimated that Charley hit category 5 status with sustained winds of 160mph in a very narrow area around the eye. Around 430 pm edt the eye of Charley made second landfall near Punta Gorda with sustained winds around 160 mph. Hurricane force sustained winds extended about 35 miles from the center with hurricane force gust extending about 60 miles from the center. Widespread damage occured in Lee, Charlotte, and Desoto counties. Minor damage was also noted in Collier county. The most severe damage occured in Coastal Lee county and Charlotte counties. Severe Damage occured on captiva Island as Charley made landfall at peak intensity. Storm surge is only estimated at around 10 feet cause of the northest movement of the storm prevented a more severe surge. Most buildings on Captiva island sustained Severe damage. A inlet a couple hundred yards wide also cut thru the island. Damage in the Charlotte County area was more severe due to mobile homes and older buildings. Most buildings in the landfall zone in Charlotte county sustained Severe or total damage from the winds. Most mobile homes were destroyed along with many roofs missing off busnisses and homes. Charlotte Regional Medical Center sustained Severe damage along with the Charlotte County Sherffis dept building was destroyed. As Charley moved inland Severe damage was also noted in Arcadia where winds estimated around 140mph caused devestation and blew the roof of a shelter off. later in the night Charley passed over Orlando Florida where wind gust of over 100mph occured causing widespread power outages and damage. As Charley exited Florida just off Daytona beach with sustained winds estimated at 80mph Charley made landfall again on Midday on the 14th near Cape Ramin in South Carolina with sustained winds of 80mph. The center moved offshore once again and made landfall near Myrtle Beach with sustained winds of 80mph. Charley then moved over North carolina and Virgina where he became Extra Tropical and became intrained with a frontal system over New England.
b. Meteorlogical statistics
The hurricane's peak intensity is estimated to be 140 kt, which occurred at landfall in Cayo Costa, FL, and Punta Gorda. As usual, there were no official surface anemometer measurements of wind speeds even approaching the intensity estimate near the landfall location. The wind sensor at the Punta Gorda ASOS site, which experienced the eyewall of Charley, stopped reporting after measuring a sustained wind of 78 kt at 2034 UTC with a gust to 97 kt at 2036 UTC. Ten minutes later, the site reported its lowest pressure, 964.5 mb. A unoffical obeservation of a 179 mph gust was recorded on a private device on captiva, as well as a 173mph gust at the Charlotte county regional medical center. Since it is presumed that the center was closest to the Punta Gorda site at the time of lowest pressure, and since Charley's maximum winds covered an extremely small area, it is highly likely that much stronger winds would have been observed at the site. Sustained winds over Sanible Island were likely in the range of 100-115 mph and sustained around 80-100mph along the mainland Lee County coast, and sustained around 60mph with gust to about 80mph in the Naples area. Observations from Cuba indicate that Charley was of Category 3 intensity as it crossed the island. Radar and microwave imagery suggest that the hurricane was strengthening as it approached the south coast of Cuba. Storm surge heights of 13 ft were determined from high water marks at Playa Cajio on the south coast.
Rainfall totals of up to about 5 inches were reported in western Cuba. Maximum rainfall totals from gauges in Florida ranged up to a little over 5 inches, but radar-estimated storm total precipitation over central Florida were as high as 8 inches.
A storm surge of 4.2 feet was measured by a tide gauge in Estero Bay, near Horseshoe Key. This is near Fort Myers Beach. Storm surges of 3.4 and 3.6 feet were measured on tide gauges on the Caloosahatchee River, near Fort Myers. There were also visual estimates of storm surges of 6 to 7 feet on Sanibel and Estero Islands with possible higher amounts on Captiva.
c. Best track for hurricane Charley
Date/Time
(UTC) Position Pressure
(mb) Wind Speed
(kt) Stage
Lat.
(°N) Lon.
(°W)
09 / 1200 11.4 59.2 1010 30 tropical depression
09 / 1800 11.7 61.1 1009 30 "
10 / 0000 12.2 63.2 1009 30 "
10 / 0600 12.9 65.3 1007 35 tropical storm
10 / 1200 13.8 67.6 1004 40 "
10 / 1800 14.9 69.8 1000 45 "
11 / 0000 15.6 71.8 999 55 "
11 / 0600 16.0 73.7 999 55 "
11 / 1200 16.3 75.4 995 60 "
11 / 1800 16.7 76.8 993 65 hurricane
12 / 0000 17.4 78.1 992 65 "
12 / 0600 18.2 79.3 988 75 "
12 / 1200 19.2 80.7 984 80 "
12 / 1800 20.5 81.6 980 90 "
13 / 0000 21.7 82.2 976 90 "
13 / 0600 23.0 82.6 966 105 "
13 / 1200 24.4 82.9 969 110 "
13 / 1400 24.9 82.8 965 115 "
13 / 1700 25.7 82.5 954 130 "
13 / 1800 26.1 82.4 947 140 "
14 / 0000 28.1 81.6 970 80 "
14 / 0600 30.1 80.8 993 75 "
14 / 1200 32.3 79.7 988 65 "
14 / 1800 34.5 78.1 1000 60 tropical storm
15 / 0000 36.9 75.9 1012 40 extratropical
15 / 0600 39.3 73.8 1014 35 "
15 / 1200 41.2 71.1 1018 30 "
15 / 1800 merged with front
13 / 0430 22.7 82.6 966 105 landfall on south coast ofCubanear Playa del Cajio
13 / 1945 26.6 82.2 941 140 landfall near Cayo Costa, FL, and minimum pressure
13 /2045 26.9 82.1 941 140 Landfall near Punta Gorda, FL
14 / 1400 33.0 79.4 992 70 landfall near Cape Romain, SC
14 / 1600 33.8 78.7 997 65 landfall near Myrtle Beach, SC
Hurricane Charley
Aug 9-15, 2004
Tom S
Midwest Hurricane Center
Updated Jan 11 2004
Hurricane Charley was a category five hurricane on the Saffir/Simpson hurricane scale that made landfall along Captiva Island in Southwest Florida on the Afternoon of August 13 and caused devestating damage in Charlotte County and surronding areas. Preliminary figures show damage to be at least 30 billion dollars along with estimated 25 fatalities.
a. History.
Charley formed from a westward moving tropical wave on August 9th about 100 miles east of the Winward Islands. Charley moved at a very fast speed to just south of Jamacia on the 11th as a hurricane and made landfall early on the 13th near Playa Del Cajio with sustained winds estimated at 120 mph. Charley weakend to a category two hurricane with sustained winds of 110mph while moving over western Cuba and moved over the Dry Tortugas while once again becoming a major hurricane. It's estimated around 11am eastern time Charley became a category 4 hurricane with sustained winds around 135mph. Over the next several hours leading to landfall Charley based on radar and satellite continued to rapidly intensify and around 3pm edt right before first landfall on Captiva Island it's estimated that Charley hit category 5 status with sustained winds of 160mph in a very narrow area around the eye. Around 430 pm edt the eye of Charley made second landfall near Punta Gorda with sustained winds around 160 mph. Hurricane force sustained winds extended about 35 miles from the center with hurricane force gust extending about 60 miles from the center. Widespread damage occured in Lee, Charlotte, and Desoto counties. Minor damage was also noted in Collier county. The most severe damage occured in Coastal Lee county and Charlotte counties. Severe Damage occured on captiva Island as Charley made landfall at peak intensity. Storm surge is only estimated at around 10 feet cause of the northest movement of the storm prevented a more severe surge. Most buildings on Captiva island sustained Severe damage. A inlet a couple hundred yards wide also cut thru the island. Damage in the Charlotte County area was more severe due to mobile homes and older buildings. Most buildings in the landfall zone in Charlotte county sustained Severe or total damage from the winds. Most mobile homes were destroyed along with many roofs missing off busnisses and homes. Charlotte Regional Medical Center sustained Severe damage along with the Charlotte County Sherffis dept building was destroyed. As Charley moved inland Severe damage was also noted in Arcadia where winds estimated around 140mph caused devestation and blew the roof of a shelter off. later in the night Charley passed over Orlando Florida where wind gust of over 100mph occured causing widespread power outages and damage. As Charley exited Florida just off Daytona beach with sustained winds estimated at 80mph Charley made landfall again on Midday on the 14th near Cape Ramin in South Carolina with sustained winds of 80mph. The center moved offshore once again and made landfall near Myrtle Beach with sustained winds of 80mph. Charley then moved over North carolina and Virgina where he became Extra Tropical and became intrained with a frontal system over New England.
b. Meteorlogical statistics
The hurricane's peak intensity is estimated to be 140 kt, which occurred at landfall in Cayo Costa, FL, and Punta Gorda. As usual, there were no official surface anemometer measurements of wind speeds even approaching the intensity estimate near the landfall location. The wind sensor at the Punta Gorda ASOS site, which experienced the eyewall of Charley, stopped reporting after measuring a sustained wind of 78 kt at 2034 UTC with a gust to 97 kt at 2036 UTC. Ten minutes later, the site reported its lowest pressure, 964.5 mb. A unoffical obeservation of a 179 mph gust was recorded on a private device on captiva, as well as a 173mph gust at the Charlotte county regional medical center. Since it is presumed that the center was closest to the Punta Gorda site at the time of lowest pressure, and since Charley's maximum winds covered an extremely small area, it is highly likely that much stronger winds would have been observed at the site. Sustained winds over Sanible Island were likely in the range of 100-115 mph and sustained around 80-100mph along the mainland Lee County coast, and sustained around 60mph with gust to about 80mph in the Naples area. Observations from Cuba indicate that Charley was of Category 3 intensity as it crossed the island. Radar and microwave imagery suggest that the hurricane was strengthening as it approached the south coast of Cuba. Storm surge heights of 13 ft were determined from high water marks at Playa Cajio on the south coast.
Rainfall totals of up to about 5 inches were reported in western Cuba. Maximum rainfall totals from gauges in Florida ranged up to a little over 5 inches, but radar-estimated storm total precipitation over central Florida were as high as 8 inches.
A storm surge of 4.2 feet was measured by a tide gauge in Estero Bay, near Horseshoe Key. This is near Fort Myers Beach. Storm surges of 3.4 and 3.6 feet were measured on tide gauges on the Caloosahatchee River, near Fort Myers. There were also visual estimates of storm surges of 6 to 7 feet on Sanibel and Estero Islands with possible higher amounts on Captiva.
c. Best track for hurricane Charley
Date/Time
(UTC) Position Pressure
(mb) Wind Speed
(kt) Stage
Lat.
(°N) Lon.
(°W)
09 / 1200 11.4 59.2 1010 30 tropical depression
09 / 1800 11.7 61.1 1009 30 "
10 / 0000 12.2 63.2 1009 30 "
10 / 0600 12.9 65.3 1007 35 tropical storm
10 / 1200 13.8 67.6 1004 40 "
10 / 1800 14.9 69.8 1000 45 "
11 / 0000 15.6 71.8 999 55 "
11 / 0600 16.0 73.7 999 55 "
11 / 1200 16.3 75.4 995 60 "
11 / 1800 16.7 76.8 993 65 hurricane
12 / 0000 17.4 78.1 992 65 "
12 / 0600 18.2 79.3 988 75 "
12 / 1200 19.2 80.7 984 80 "
12 / 1800 20.5 81.6 980 90 "
13 / 0000 21.7 82.2 976 90 "
13 / 0600 23.0 82.6 966 105 "
13 / 1200 24.4 82.9 969 110 "
13 / 1400 24.9 82.8 965 115 "
13 / 1700 25.7 82.5 954 130 "
13 / 1800 26.1 82.4 947 140 "
14 / 0000 28.1 81.6 970 80 "
14 / 0600 30.1 80.8 993 75 "
14 / 1200 32.3 79.7 988 65 "
14 / 1800 34.5 78.1 1000 60 tropical storm
15 / 0000 36.9 75.9 1012 40 extratropical
15 / 0600 39.3 73.8 1014 35 "
15 / 1200 41.2 71.1 1018 30 "
15 / 1800 merged with front
13 / 0430 22.7 82.6 966 105 landfall on south coast ofCubanear Playa del Cajio
13 / 1945 26.6 82.2 941 140 landfall near Cayo Costa, FL, and minimum pressure
13 /2045 26.9 82.1 941 140 Landfall near Punta Gorda, FL
14 / 1400 33.0 79.4 992 70 landfall near Cape Romain, SC
14 / 1600 33.8 78.7 997 65 landfall near Myrtle Beach, SC
0 likes
-
Hurricanehink
- S2K Supporter

- Posts: 2047
- Joined: Sun Nov 16, 2003 2:05 pm
- Location: New Jersey
-
Guest
Hurricanehink wrote:Whoa, wxmania, where did you find that? Is that at all official?
Close to it, but no. Its independant by myself and my fellow forecaster at MWHC. Upon talking to Richard Pasch and the NHC using only 88 percent flight level I conclude Charley was close to 160 at landfall. Also as I have discussed with Dr. Landsea Charley's eye became more intense due to friction right at landfall. Joe Bastardi likes the theroy of eyes getting tighter at landfall.
0 likes

-
Hurricanehink
- S2K Supporter
- Posts: 2047
- Joined: Sun Nov 16, 2003 2:05 pm
- Location: New Jersey
-
Scorpion
-
cycloneye

- Admin

- Posts: 148883
- Age: 69
- Joined: Thu Oct 10, 2002 10:54 am
- Location: San Juan, Puerto Rico
Hurricane Alex Report
http://ratfish.nhc.noaa.gov/2004alex.shtml?
Tropical Storm Bonnie Report
http://ratfish.nhc.noaa.gov/2004bonnie.shtml?
Hurricane Charley Report
http://www.nhc.noaa.gov/2004charley.shtml?
Hurricane Danielle Report
http://ratfish.nhc.noaa.gov/2004danielle.shtml
Tropical Storm Earl Report
http://ratfish.nhc.noaa.gov/2004earl.shtml?
Hurricane Frances Report
http://ratfish.nhc.noaa.gov/2004frances.shtml?
Hurricane Gaston Report
http://www.nhc.noaa.gov/2004gaston.shtml?
Tropical Storm Hermine Report
http://www.nhc.noaa.gov/2004hermine.shtml?
Hurricane Ivan Report
http://www.nhc.noaa.gov/2004ivan.shtml
Tropical Depression Ten Report
http://ratfish.nhc.noaa.gov/2004ten.shtml
Hurricane Jeanne Report
http://www.nhc.noaa.gov/2004jeanne.shtml
Hurricane Karl Report
http://www.nhc.noaa.gov/2004karl.shtml?
Hurricane Lisa Report
http://ratfish.nhc.noaa.gov/2004lisa.shtml
Tropical Storm Matthew Report
http://ratfish.nhc.noaa.gov/2004matthew.shtml?
SubTropical Storm Nicole Report
http://www.nhc.noaa.gov/2004nicole.shtml
Tropical Storm Otto Report
http://ratfish.nhc.noaa.gov/2004otto.shtml?
Here are all the reports for all the systems for the 2004 season.Very interesting data in many of the most important ones like Ivan,Charley,Frances and Jeanne.
0 likes
Visit the Caribbean-Central America Weather Thread where you can find at first post web cams,radars
and observations from Caribbean basin members Click Here
and observations from Caribbean basin members Click Here

Who is online
Users browsing this forum: hcane27 and 93 guests