chaser1 wrote:In concert with the Climate Prediction Center from last night, I can see where at least the 6Z GFS might be suggesting a "rough" convergence of a weak sloppy LLC in the EGOM beginning late Monday/early Tuesday next week. Primary genesis seems to originate from the southern end of a decaying surface trough just east of Jacksonville. The weak surface feature appears to split off and shift southwestward to just west of South Florida. The catalyst for possible development was hard to find however with little to nothing showing up in any of the GFS surface or low to mid level vorticity charts. While looking at the broader basin 300mb -700mb RH forecast (and a rather dry Atlantic), I noticed what appeared to be a fairly large & defined mid level low that appears trapped under the strong mid level ridging forcing it westward and approx centered near S Florida by around Tuesday/Wednesday next week. Right now the entire hot-mess would appear to be broad with the initial surface feature a bit further west & north. Too few details, too little model support, timing and conditions remain to be known yet but I could see a low-end possibility (10%-20%) for a TD to develop around the Upper Texas coast sometime later next week.
Some really astute observations and definitely a unique process that may unfold later next week. As you stated above, finding the origins for development can be difficult in this particular scenario and I'll explain why. First, our trigger is really
barotropic instability here, which will 'spawn' a series of what we call
edge waves. Let's start with the general setup at 72 hours on the GFS first though, and I’ll explain later why we expect such an evolution:

The stage is really set by two key features in the atmosphere:
expanding high pressure in the eastern Atlantic heading west, and
expanding high pressure over the northeast CONUS. These high-pressure systems create a dynamic environment by "stretching" or elongating a
potential vorticity (PV) streamer. Papin has done some tremendous work on PV streamers (
https://journals.ametsoc.org/view/journals/mwre/151/4/MWR-D-22-0038.1.xml), but I’ll summarize it as basically this: they are narrow bands of air with high vorticity (a measure of rotation in the atmosphere) often associated with the jet stream or upper-level troughs. In this scenario, the PV streamer is stretched out towards the eastern CONUS/GOM, setting up a favorable environment for instability. Additionally, a
tropical wave passing through the Bahamas provides an extra ‘boost’ to this setup.
So this is our basic setup, but what's the ultimate trigger? And more importantly, what’s the eventual outcome (e.g., tropical cyclone)? That’s a bit trickier to figure out, and the first thing we need to identify are some other key features to look for.
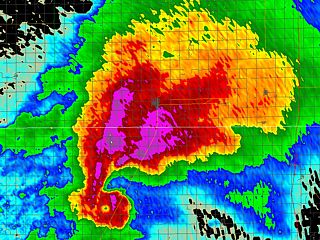
VorticityThe first thing we want to identify is where our PV axis is. There are various products we can use to do this (350-K isentropic, PV surfaces, 2 PVU bounded, etc.) and I’ll use the 2 PVU bounded surface product from Pivotal here (animated out to 120 hours):
 Moisture
I’m going to highly suggest checking out some of the products that Alicia Bentley made while doing her doctoral degree at Albany (
https://www.atmos.albany.edu/student/abentley/realtime.html) (side note: she now works at the NOAA with the EMC verification team -
https://www.emc.ncep.noaa.gov/users/verification/). In particular, when dealing with these types of situations, I really like to look at the 700 hPa heights with the integrated water vapor transport (IVT) product:
 https://www.atmos.albany.edu/student/abentley/realtime/standard.php?domain=northamer&variable=IVT_conv
So in one product, we get:
- The 700 hPa height contours that let us assess the mid-level structure of the atmosphere (e.g., troughs, ridges, areas of rotation/vorticity, etc.).
- IVT shaded, which measures the transport of water vapor through the atmosphere, integrated from the surface to the upper levels.
- And more significantly, we get IVT vectors—this highlights regions where large amounts of moisture are being transported (and where our tropical wave comes into play here).
Why is this important? Why did I just go down a side tangent to explain what IVT is? Because we have a process that is starting out barotropic, but we want to identify if the ultimate outcome is a tropical cyclone. We are going to need moisture transport and latent heat for this. Now let’s go revisit our friend barotropic instability again.
InstabilityLike I stated above in the first section, barotropic instability is our main forcing mechanism here. This occurs in regions where there is a strong horizontal shear in the wind field, often near a jet stream or a PV streamer. In this case, the
stretching of the PV streamer by the
high-pressure systems creates a zone of strong wind shear, and it’s this shear that destabilizes the flow, making it prone to breaking down into smaller, rotating features.
Think of barotropic instability like a river flowing over rocks: the smooth flow (the PV streamer) encounters an obstacle (shear from the high-pressure systems), causing the flow to break into eddies or swirls. As the barotropic instability takes hold, the PV streamer doesn’t remain a single, coherent feature. Instead, it begins to break apart into smaller, wavelike disturbances called edge waves (which eventually evolve into vorticity maximums). So we know what causes this (shear), and this is likely going to cause edge waves (vort maxes), but what exactly are these in the real world? What do they look like? Let’s take a step back and look at that first.
Edge waves aren’t too dissimilar from Rossby waves (you can check out my post on Rossby waves and wave breaking here -
https://www.storm2k.org/phpbb2/viewtopic.php?p=3123290#p3123290). The main difference is Rossby waves are a result of planetary vorticity gradients, while edge waves rely on background relative vorticity gradients AND are confined to an edge in the velocity profile. This is a modeled simulation, but essentially the mechanisms can be seen here (
https://atmos.washington.edu/cgi-bin/wxloop.cgi?/home/disk/user_www/hakim/542/baro/+all).
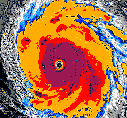
This is a classic example of edge waves in the high latitudes, consolidating into vort maximums on water vapor satellite imagery:

Now let’s go apply this to our latest GFS run, and I’ll highlight where the model has these edge waves (confined to the edge around the high pressure area) consolidate into vorticity maximums next week:

Hopefully I haven’t gone too far down the rabbit hole here, but we can now summarize everything as such:
- As the edge waves grow, they can break off from the main PV streamer, forming multiple, independent areas of vorticity.
- Each edge wave can develop into a vortex or a vorticity maximum.
- The tropical wave in the Bahamas adds energy and moisture to the system, potentially enhancing the development of these vorticity centers by providing additional lift and instability.
The result is a series of discrete vorticity areas, which could manifest as multiple low-pressure systems, mesoscale convective systems, or even potential tropical or subtropical cyclones, depending on the environment. How good are models at forecasting these scenarios 120+ hours out? I don’t have an exact numerical verification score, but I can tell you it is an extremely difficult process to model and their skill would be low. Definitely something cool to watch over the next week and to see if all the ingredients come together though.