In Michael Lowry's latest update he cautions that it doesn't take much to flip the August switch and have a totally different set up at hand.
Tropical Wave Train Picking Up but Models Muted for Now
Robust tropical waves dotting the eastern Atlantic tell us it’s August, but models aren’t biting just yet
MICHAEL LOWRY
AUG 7
The sporadic sputtering of tropical waves peppering the Atlantic as they roll westward from Africa to the Caribbean is the telltale sign of August, but for now forecast models remain cold to development.
Enhanced satellite loop from last Wednesday, August 2, 2023, through this morning (August 7, 2023) showing the occasional firing of storminess around tropical waves moving westward through the eastern and central Atlantic.
Nevertheless, it’s the time of year when subtle shifts – a change in day or location – can alter the outlook in a hurry. It’s the time of year we pay closer attention to these disturbances that might otherwise go overlooked in June and July.
Tropical waves – ripples in the east-to-west flowing atmospheric winds about 10,000 feet up that resemble ocean waves – are with us throughout hurricane season, but it’s in August that they have the greatest chance of development.
Average number of tropical systems that form from deep tropical African Easterly Waves (AEW) by month. August and September typically see the highest number of waves developing into storms.
Although tropical waves are the seedlings for over half of all named storms each hurricane season, nearly 85% of the strongest Category 3, 4, and 5 hurricanes arise from them. So the waves are important, especially in August and September.
We’ll be watching two waves this week in the Atlantic, one currently midway between Africa and the Caribbean and the other just west of Africa. For now, they’re tangled up within an umbilical cord of storminess and background spin called the monsoon trough, which is giving them some flare on satellite.
Both of these disturbances will be driving westward this week, and although wind shear remains relatively light, a healthy dose of dry, sinking air east of the Caribbean islands will limit their development potential in the near term. As we discussed last Thursday, we’ll want to keep an eye on the westernmost disturbance as it enters the Caribbean later this week where conditions may become a little less hostile.
That said, none of our models show significant development in the week ahead with either of these two waves, but we’ll keep an eye on them for any mischief down the road.
2023 Indicators (SST, SAL, MSLP, Wind shear, Steering, Instability) and Day 16+ Models
Moderator: S2k Moderators
Forum rules

The posts in this forum are NOT official forecasts and should not be used as such. They are just the opinion of the poster and may or may not be backed by sound meteorological data. They are NOT endorsed by any professional institution or STORM2K. For official information, please refer to products from the National Hurricane Center and National Weather Service.
-
toad strangler

- S2K Supporter

- Posts: 4546
- Joined: Sun Jul 28, 2013 3:09 pm
- Location: Earth
- Contact:
-
SFLcane

- S2K Supporter
- Posts: 10281
- Age: 48
- Joined: Sat Jun 05, 2010 1:44 pm
- Location: Lake Worth Florida
Re: 2023 Indicators (SST, SAL, MSLP, Wind shear, Steering, Instability) and Day 16+ Models
toad strangler wrote:In Michael Lowry's latest update he cautions that it doesn't take much to flip the August switch and have a totally different set up at hand.
Tropical Wave Train Picking Up but Models Muted for Now
Robust tropical waves dotting the eastern Atlantic tell us it’s August, but models aren’t biting just yet
MICHAEL LOWRY
AUG 7
The sporadic sputtering of tropical waves peppering the Atlantic as they roll westward from Africa to the Caribbean is the telltale sign of August, but for now forecast models remain cold to development.
Enhanced satellite loop from last Wednesday, August 2, 2023, through this morning (August 7, 2023) showing the occasional firing of storminess around tropical waves moving westward through the eastern and central Atlantic.
Nevertheless, it’s the time of year when subtle shifts – a change in day or location – can alter the outlook in a hurry. It’s the time of year we pay closer attention to these disturbances that might otherwise go overlooked in June and July.
Tropical waves – ripples in the east-to-west flowing atmospheric winds about 10,000 feet up that resemble ocean waves – are with us throughout hurricane season, but it’s in August that they have the greatest chance of development.
Average number of tropical systems that form from deep tropical African Easterly Waves (AEW) by month. August and September typically see the highest number of waves developing into storms.
Although tropical waves are the seedlings for over half of all named storms each hurricane season, nearly 85% of the strongest Category 3, 4, and 5 hurricanes arise from them. So the waves are important, especially in August and September.
We’ll be watching two waves this week in the Atlantic, one currently midway between Africa and the Caribbean and the other just west of Africa. For now, they’re tangled up within an umbilical cord of storminess and background spin called the monsoon trough, which is giving them some flare on satellite.
Both of these disturbances will be driving westward this week, and although wind shear remains relatively light, a healthy dose of dry, sinking air east of the Caribbean islands will limit their development potential in the near term. As we discussed last Thursday, we’ll want to keep an eye on the westernmost disturbance as it enters the Caribbean later this week where conditions may become a little less hostile.
That said, none of our models show significant development in the week ahead with either of these two waves, but we’ll keep an eye on them for any mischief down the road.
Might take more than a subtle shift I think at least in the background. Nothing has been close to developing yet but Climatology does get better.
2 likes


Re: 2023 Indicators (SST, SAL, MSLP, Wind shear, Steering, Instability) and Day 16+ Models
I'm not sure if it's with the color scale on TropicalTidbits, but water vapor actually doesn't look too bad here:
2 likes
TC naming lists: retirements and intensity
Most aggressive Advisory #1's in North Atlantic (cr. kevin for starting the list)
Most aggressive Advisory #1's in North Atlantic (cr. kevin for starting the list)
Re: 2023 Indicators (SST, SAL, MSLP, Wind shear, Steering, Instability) and Day 16+ Models
Teban54 wrote:I'm not sure if it's with the color scale on TropicalTidbits, but water vapor actually doesn't look too bad here:
https://i.postimg.cc/g2tc9rk0/goes16-wv-rgb-atl.gif
The wave in the east Atlantic (28-29W) would give me pause most years, but multiple models show it falling apart tonight. The sinking mid level dry air is there on that map too. East Pacific is really active right now and when that's going, Atlantic is usually out to lunch.
1 likes
-
cycloneye

- Admin

- Posts: 148718
- Age: 69
- Joined: Thu Oct 10, 2002 10:54 am
- Location: San Juan, Puerto Rico
Re: 2023 Indicators (SST, SAL, MSLP, Wind shear, Steering, Instability) and Day 16+ Models
Here is Bryan Norcross take about the rest of the season.
https://www.hurricaneintel.com/post/thi ... t-ballgame
https://www.hurricaneintel.com/post/thi ... t-ballgame
With last season's hyperactive September in our minds, it's hard to remember that August was quiet. Freakishly so. A combination of Saharan dust and dry air from the north kept disturbances moving off Africa from developing in the tropical Atlantic. Then on September 1, the typical atmospheric mechanisms that power the tropics kicked in with a vengeance.
Zero storms formed from July 3 to August 31. That has not happened since before World War II. Then four hurricanes and two tropical storms were named in September, including of course, Hurricanes Fiona and Ian. The Puerto Rico and near Fort Myers landfalls were 10 days apart.
Zero storms formed from July 3 to August 31. That has not happened since before World War II. Then four hurricanes and two tropical storms were named in September, including of course, Hurricanes Fiona and Ian. The Puerto Rico and near Fort Myers landfalls were 10 days apart.
Equating this year to last is tempting since we've seemingly hit a lull again. There is a similarity in the extensive dust and dry air over the tropical ocean, but the macro weather and ocean patterns are very different.
The combination of a developing warm tongue of water in the equatorial Pacific south of Hawaii – the phenomenon called El Niño – and the highly unusual distribution of super-warm water in the eastern Atlantic is unprecedented. How these two pools of high-temperature ocean will interact is difficult to predict.
The combination of a developing warm tongue of water in the equatorial Pacific south of Hawaii – the phenomenon called El Niño – and the highly unusual distribution of super-warm water in the eastern Atlantic is unprecedented. How these two pools of high-temperature ocean will interact is difficult to predict.
Predictions from the variety of universities, agencies, and forecasting groups around the world range from a season with more-or-less average activity to one that would be one of the busiest on record. The range reflects the uncertainty intrinsic in the unique combination of ocean-temperature profiles.
Colorado State University's seasonal-forecasting group issued their final forecast of the year last week, calling for a total of 18 named storms, 9 of them being hurricanes, 4 Category 3 or above. For perspective, that means the rest of the season would be slightly above average.
Since 5 named storms have come and gone – including a posthumously re-categorized storm in the North Atlantic last January – 13 storms would be left to form. According to the National Hurricane Center, 11 named storms form after today's date in an average year, so we're not talking about a crazy deviation. In addition, these days, we name 1 or 2 more storms each year anyway because of technological advances compared to the beginning of the official averaging period in the 90s.
There are 8 hurricanes yet to form, according to the CSU forecast, compared to an average of 7. And 4 Cat 3+ storms compared to an average of 3. These numbers reflect the likelihood that the extra-warm eastern tropical Atlantic will help a couple of storms get stronger than they otherwise would have once the dry and dusty weather pattern lets up.
Myriad questions abound, of course. The El Niño developing in the Pacific appears on pace to land in the moderate to strong category when it peaks later this year – a normal and expected process. The mass of super-warm water in the eastern Atlantic is not normal, however. And the water temperatures averaged across the whole planet have been at record levels.
Is the Atlantic phenomenon part of whatever is causing the widespread oceanic warming, or is a different mechanism at work? Is the worldwide heat wave a tipping point or just a fluke caused by factors that happened to come together this year? These questions and more will draw a lot of analysis and discussion from the scientific community over the years to come.
While hurricanes will still be powered by heat from the ocean water, and the atmospheric factors that strengthen or weaken storms will be unchanged, the unknown is whether this very modern and unusual distribution of large pools of extremely warm water will change what's "normal" in a hurricane season in ways that aren't immediately obvious.
4 likes
Visit the Caribbean-Central America Weather Thread where you can find at first post web cams,radars
and observations from Caribbean basin members Click Here
and observations from Caribbean basin members Click Here
-
jconsor
- Professional-Met

- Posts: 569
- Joined: Mon Jun 30, 2008 9:31 pm
- Location: Jerusalem, Israel
- Contact:
Re: 2023 Indicators (SST, SAL, MSLP, Wind shear, Steering, Instability) and Day 16+ Models
Some important context regarding the Aug ECMWF seasonal hurricane outlook:
https://twitter.com/yconsor/status/1688549317508767744
https://twitter.com/yconsor/status/1688551698241839105
https://twitter.com/yconsor/status/1688554727712190464
https://twitter.com/yconsor/status/1688559498032517120
https://twitter.com/yconsor/status/1688559928556793857
https://twitter.com/yconsor/status/1688549317508767744
https://twitter.com/yconsor/status/1688551698241839105
https://twitter.com/yconsor/status/1688554727712190464
https://twitter.com/yconsor/status/1688559498032517120
https://twitter.com/yconsor/status/1688559928556793857
WeatherBoy2000 wrote:https://twitter.com/DerekOrtt/status/1687843526287994881
Latest EC forecast doesn't include August.
Last edited by jconsor on Mon Aug 07, 2023 1:06 pm, edited 1 time in total.
3 likes
Re: 2023 Indicators (SST, SAL, MSLP, Wind shear, Steering, Instability) and Day 16+ Models
LarryWx wrote::eek:The last few runs of the CFS have been showing significant negative anomalies of shear over the Caribbean throughout August and into the first part of September even in the face of a strengthening El Niño. Does anyone feel that the CFS is out to lunch? I sure hope it is because otherwise this could be a scary month into early September considering the very warm MDR. If that were to occur, hopefully there will be a tendency for recurvature east of the Lesser Antilles and into the C Atlantic.
When I posted the above yesterday about the relatively low shear being forecasted by the admittedly inferior CFS, I didn't realize that increased westerly Caribbean shear was being modeled on the recent GFS/Euro runs for 8/15-16. The shear then actually looks pretty strong. I need to reassess the model consensus for Caribbean shear from midmonth on.
Any thoughts from anyone about midmonth+ Caribbean shear?
1 likes
Personal Forecast Disclaimer:
The posts in this forum are NOT official forecasts and should not be used as such. They are just the opinion of the poster and may or may not be backed by sound meteorological data. They are NOT endorsed by any professional institution or storm2k.org. For official information, please refer to the NHC and NWS products.
The posts in this forum are NOT official forecasts and should not be used as such. They are just the opinion of the poster and may or may not be backed by sound meteorological data. They are NOT endorsed by any professional institution or storm2k.org. For official information, please refer to the NHC and NWS products.


Re: 2023 Indicators (SST, SAL, MSLP, Wind shear, Steering, Instability) and Day 16+ Models
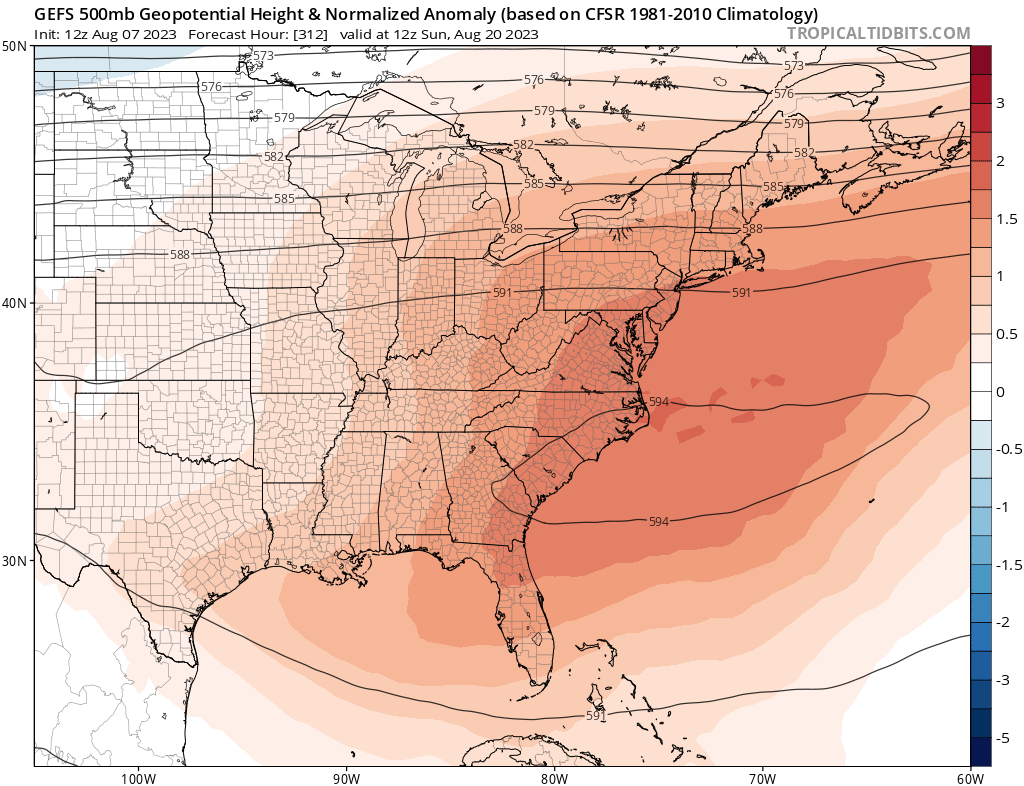
In the mid-latitudes the East Coast/Mid-Atlantic trough has been pretty persistent. Been tracking this to see if the change would occur and so far the guidance has tried a few times and yet to pan out. Perhaps it will the second half of August, Boston to DC is experiencing a cool summer thus far. Suspect the very warm Atlantic south of Greenland is causing a Rex-block to keep the trof stubborn.

1 likes
The above post and any post by Ntxw is NOT an official forecast and should not be used as such. It is just the opinion of the poster and may or may not be backed by sound meteorological data. It is NOT endorsed by any professional institution including Storm2k. For official information, please refer to NWS products.
Help support Storm2K!
-
cycloneye
- Admin
- Posts: 148718
- Age: 69
- Joined: Thu Oct 10, 2002 10:54 am
- Location: San Juan, Puerto Rico
Re: 2023 Indicators (SST, SAL, MSLP, Wind shear, Steering, Instability) and Day 16+ Models
2023 season is doing fine with 5/1/0 and before the average dates. Here are the averages that normally occur that is 14/7/3.
Source: https://www.nhc.noaa.gov/climo/
Progress of the average Atlantic season (1991-2020). Date upon which the following number of events would normally have occurred.
Number Named systems Hurricanes Major Hurricanes
1 Jun 20 Aug 11 Sep 1
2 Jul 17 Aug 26 Sep 19
3 Aug 3 Sep 7 Oct 28
4 Aug 15 Sep 16 -
5 Aug 22 Sep 28 -
6 Aug 29 Oct 15 -
7 Sep 3 Nov 15 -
8 Sep 9 - -
9 Sep 16 - -
10 Sep 22 - -
11 Oct 2 - -
12 Oct 11 - -
13 Oct 25 - -
14 Nov 19
Number Named systems Hurricanes Major Hurricanes
1 Jun 20 Aug 11 Sep 1
2 Jul 17 Aug 26 Sep 19
3 Aug 3 Sep 7 Oct 28
4 Aug 15 Sep 16 -
5 Aug 22 Sep 28 -
6 Aug 29 Oct 15 -
7 Sep 3 Nov 15 -
8 Sep 9 - -
9 Sep 16 - -
10 Sep 22 - -
11 Oct 2 - -
12 Oct 11 - -
13 Oct 25 - -
14 Nov 19
Source: https://www.nhc.noaa.gov/climo/
1 likes
Visit the Caribbean-Central America Weather Thread where you can find at first post web cams,radars
and observations from Caribbean basin members Click Here
and observations from Caribbean basin members Click Here
-
gatorcane

- S2K Supporter
- Posts: 23703
- Age: 47
- Joined: Sun Mar 13, 2005 3:54 pm
- Location: Boca Raton, FL
Re: 2023 Indicators (SST, SAL, MSLP, Wind shear, Steering, Instability) and Day 16+ Models
Ntxw wrote:In the mid-latitudes the East Coast/Mid-Atlantic trough has been pretty persistent. Been tracking this to see if the change would occur and so far the guidance has tried a few times and yet to pan out. Perhaps it will the second half of August, Boston to DC is experiencing a cool summer thus far. Suspect the very warm Atlantic south of Greenland is causing a Rex-block to keep the trof stubborn.
https://i.imgur.com/ORgWjAo.gif
Here in South Florida it has been one of the wettest since I could remember with the general west to east steering flow to push storms over to the east coast. Sarasota on the west coast has had one of the driest summers on record I heard due to the this persistent trough keeping a west wind pattern over the state. The Bermuda High doesn’t seem that strong this summer so far.
0 likes
Re: 2023 Indicators (SST, SAL, MSLP, Wind shear, Steering, Instability) and Day 16+ Models
LarryWx wrote: When I posted the above yesterday about the relatively low shear being forecasted by the admittedly inferior CFS, I didn't realize that increased westerly Caribbean shear was being modeled on the recent GFS/Euro runs for 8/15-16. The shear then actually looks pretty strong. I need to reassess the model consensus for Caribbean shear from midmonth on.
Any thoughts from anyone about midmonth+ Caribbean shear?
Followup: 12Z GFS: Caribbean shear picks up Aug 12 and is strong the rest of the run. The 12Z GEFS also increases shear there Aug 12 and it is strong through at least Aug 17th (that's as far as run is out so far).
1 likes
Personal Forecast Disclaimer:
The posts in this forum are NOT official forecasts and should not be used as such. They are just the opinion of the poster and may or may not be backed by sound meteorological data. They are NOT endorsed by any professional institution or storm2k.org. For official information, please refer to the NHC and NWS products.
The posts in this forum are NOT official forecasts and should not be used as such. They are just the opinion of the poster and may or may not be backed by sound meteorological data. They are NOT endorsed by any professional institution or storm2k.org. For official information, please refer to the NHC and NWS products.
-
SFLcane
- S2K Supporter
- Posts: 10281
- Age: 48
- Joined: Sat Jun 05, 2010 1:44 pm
- Location: Lake Worth Florida
Re: 2023 Indicators (SST, SAL, MSLP, Wind shear, Steering, Instability) and Day 16+ Models
gatorcane wrote:Ntxw wrote:In the mid-latitudes the East Coast/Mid-Atlantic trough has been pretty persistent. Been tracking this to see if the change would occur and so far the guidance has tried a few times and yet to pan out. Perhaps it will the second half of August, Boston to DC is experiencing a cool summer thus far. Suspect the very warm Atlantic south of Greenland is causing a Rex-block to keep the trof stubborn.
https://i.imgur.com/ORgWjAo.gif
Here in South Florida it has been one of the wettest since I could remember with the general west to east steering flow to push storms over to the east coast. Sarasota on the west coast has had one of the driest summers on record I heard due to the this persistent trough keeping a west wind pattern over the state. The Bermuda High doesn’t seem that strong this summer so far.
Oh its coming...
3 likes
Re: 2023 Indicators (SST, SAL, MSLP, Wind shear, Steering, Instability) and Day 16+ Models
As mentioned, the 12Z GEFS has strong Caribbean shear starting August 12th. That continues for about a week but then decreases to near normal Aug 20-23 while the strong shear zone shifts just to the north of the Greater Antilles.
Meanwhile as SFLcane showed, E US 500 mb ridging takes over on this run 8/19-8/23, which if it were to verify would potentially open the door to the E US for anything that might be in the W Atlantic then. Hopefully that would be shortlived if it happens.
Meanwhile as SFLcane showed, E US 500 mb ridging takes over on this run 8/19-8/23, which if it were to verify would potentially open the door to the E US for anything that might be in the W Atlantic then. Hopefully that would be shortlived if it happens.
0 likes
Personal Forecast Disclaimer:
The posts in this forum are NOT official forecasts and should not be used as such. They are just the opinion of the poster and may or may not be backed by sound meteorological data. They are NOT endorsed by any professional institution or storm2k.org. For official information, please refer to the NHC and NWS products.
The posts in this forum are NOT official forecasts and should not be used as such. They are just the opinion of the poster and may or may not be backed by sound meteorological data. They are NOT endorsed by any professional institution or storm2k.org. For official information, please refer to the NHC and NWS products.

Re: 2023 Indicators (SST, SAL, MSLP, Wind shear, Steering, Instability) and Day 16+ Models
Teban54 wrote:I'm not sure if it's with the color scale on TropicalTidbits, but water vapor actually doesn't look too bad here:
https://i.postimg.cc/g2tc9rk0/goes16-wv-rgb-atl.gif
The first wave that will be approaching the Windward islands this week is moistening up the environment a little.
Second wave a few hundred miles south west of Cape Verde islands might be invest worthy before drying out some.
Models are either seeing too much dry shear or are being suppressed.
In past years we've seen the models spin up second wave scenarios like this in early August.
1 likes

Re: 2023 Indicators (SST, SAL, MSLP, Wind shear, Steering, Instability) and Day 16+ Models
Should be interesting to see how long that dry air sticks around:
[youtube]https://youtu.be/Q9K7VtXEV2E[/youtube]
[youtube]https://youtu.be/Q9K7VtXEV2E[/youtube]
2 likes
-
Spacecoast

- Category 2

- Posts: 773
- Joined: Thu Aug 31, 2017 2:03 pm
Re: 2023 Indicators (SST, SAL, MSLP, Wind shear, Steering, Instability) and Day 16+ Models
jconsor wrote:Some important context regarding the Aug ECMWF seasonal hurricane outlook:
Two important things to keep in mind re: ECMWF's Atl hurricane season outlook:
1) Its skill for Aug forecasts is much worse than for Jul forecasts. Note correlation between forecast/observed hurricanes for Jul forecasts is 0.53, and for Aug 0.31. Similar story for ACE forecasts
Thanks for posting....
I always like to calibrate, and verify the performance of these tools.
Looking at the Sept seasonal:

Adding an (amateur) observation....
Although the correlation between forecast / observation for August is 0.31, it is also true that roughly half (15) of the 30 seasons displayed overestimated frequency, while the other half underestimated frequency. Is it possible to tell if 2023 will be the former, or the latter? idk, but there isn't any bias that I can discern.
Do these over / under estimates cancel each other out, or improve the overall skill?
Another observation is that when it underestimates frequency, sometimes it really underestimates frequency (> 1 std dev), such as:
2001 neutral
2005 neutral
2017 neutral
2018 El Nino
2020 La Nina
2022 La Nina
Most weren't El Nino years, so it would be interesting to break out correlation for El Nino vs La Nina years.
Maybe I'll try to plot this.
1 likes
-
gatorcane
- S2K Supporter
- Posts: 23703
- Age: 47
- Joined: Sun Mar 13, 2005 3:54 pm
- Location: Boca Raton, FL
Re: 2023 Indicators (SST, SAL, MSLP, Wind shear, Steering, Instability) and Day 16+ Models
LarryWx wrote:As mentioned, the 12Z GEFS has strong Caribbean shear starting August 12th. That continues for about a week but then decreases to near normal Aug 20-23 while the strong shear zone shifts just to the north of the Greater Antilles.
Meanwhile as SFLcane showed, E US 500 mb ridging takes over on this run 8/19-8/23, which if it were to verify would potentially open the door to the E US for anything that might be in the W Atlantic then. Hopefully that would be shortlived if it happens.
Yes indeed looks like quite a bit of shear. Here is the 18Z GFS animation from 120 to 258 hours. Maybe an early indicator of the El Niño shear which we could see later as we head into September and October across the Caribbean:
2 likes
-
cycloneye
- Admin
- Posts: 148718
- Age: 69
- Joined: Thu Oct 10, 2002 10:54 am
- Location: San Juan, Puerto Rico
Re: 2023 Indicators (SST, SAL, MSLP, Wind shear, Steering, Instability) and Day 16+ Models
The CPC hazards forecast has areas on weeks 2 and 3 in Western Atlantic and MDR.

3 likes
Visit the Caribbean-Central America Weather Thread where you can find at first post web cams,radars
and observations from Caribbean basin members Click Here
and observations from Caribbean basin members Click Here
Who is online
Users browsing this forum: mixedDanilo.E and 74 guests