It's still early, but we have unanimous signals for at least an above average season, perhaps hyperactive. Westerly wind bursts across the equatorial Pacific have been replaced by easterlies, and the MJO looks unable to maintain a coherent signal across the Pacific to switch these winds. Subsurface ocean heat content is decreasing, and a large cold pool is progressing. We should see steady cooling of the ENSO over the next months, with La Nina arriving before the peak of the season. The CFS suggests Nino 3.4 temperatures around -1.5C by October. This is probably a little aggressive but nonetheless gives confidence that we won't be seeing a positive ENSO for the peak. Accordingly, it depicts low shear basin-wide, coupled with above-average precipitation signals. Ocean temperatures have been above average most of this year, and forecasts show this should continue.
15-8-3 ACE 140 as a starting point?
2020 Indicators: SST's / SAL / MSLP / Steering / Shear / Instability / Sat Images
Moderator: S2k Moderators
Forum rules

The posts in this forum are NOT official forecasts and should not be used as such. They are just the opinion of the poster and may or may not be backed by sound meteorological data. They are NOT endorsed by any professional institution or STORM2K. For official information, please refer to products from the National Hurricane Center and National Weather Service.
-
TropicalAnalystwx13

- Category 5

- Posts: 2109
- Age: 28
- Joined: Tue Jul 19, 2011 8:20 pm
- Location: Wilmington, NC
- Contact:
-
Shell Mound
- Category 5
- Posts: 2432
- Age: 33
- Joined: Thu Sep 07, 2017 3:39 pm
- Location: St. Petersburg, FL → Scandinavia
Re: 2020 Indicators: SST's / SAL / MSLP / Steering / Shear / Instability / Sat Images
TropicalAnalystwx13 wrote:It's still early, but we have unanimous signals for at least an above average season, perhaps hyperactive. Westerly wind bursts across the equatorial Pacific have been replaced by easterlies, and the MJO looks unable to maintain a coherent signal across the Pacific to switch these winds. Subsurface ocean heat content is decreasing, and a large cold pool is progressing. We should see steady cooling of the ENSO over the next months, with La Nina arriving before the peak of the season. The CFS suggests Nino 3.4 temperatures around -1.5C by October. This is probably a little aggressive but nonetheless gives confidence that we won't be seeing a positive ENSO for the peak. Accordingly, it depicts low shear basin-wide, coupled with above-average precipitation signals. Ocean temperatures have been above average most of this year, and forecasts show this should continue.
15-8-3 ACE 140 as a starting point?
Most intense Atlantic seasons by ACE index (since 1950) vs. February AMO value:
1) 2005: +0.06
2) 1995: -1.33
3) 2004: +0.71
4) 2017: +0.08
5) 1950: -0.12
6) 1961: -0.13
7) 1998: +0.46
8) 1999: -0.28
9) 1969: 0.98
10) 1996: -0.44
Mean February AMO: -0.001
2020: -1.30
So far, out of all the years listed, 2020 has by far the most negative AMO value in February. Only 1995—which marked the transition between long-term -AMO/+AMO regimes—had a similarly negative value. Based solely on these data, the odds in favour of a very active 2020 season do not appear to be especially great. Your numbers and ACE look quite reasonable at this stage. Anything more than a slightly-above-average season seems quite improbable at this stage. However, things can always change.
0 likes
CVW / MiamiensisWx / Shell Mound
The posts in this forum are NOT official forecasts and should not be used as such. They are just the opinion of the poster and may or may not be backed by sound meteorological data. They are NOT endorsed by any professional institution or STORM2K. For official information, please refer to products from the NHC and NWS.
-
CyclonicFury

- Category 5
- Posts: 2038
- Age: 27
- Joined: Sun Jul 02, 2017 12:32 pm
- Location: NC
- Contact:
Re: 2020 Indicators: SST's / SAL / MSLP / Steering / Shear / Instability / Sat Images
Shell Mound wrote:TropicalAnalystwx13 wrote:It's still early, but we have unanimous signals for at least an above average season, perhaps hyperactive. Westerly wind bursts across the equatorial Pacific have been replaced by easterlies, and the MJO looks unable to maintain a coherent signal across the Pacific to switch these winds. Subsurface ocean heat content is decreasing, and a large cold pool is progressing. We should see steady cooling of the ENSO over the next months, with La Nina arriving before the peak of the season. The CFS suggests Nino 3.4 temperatures around -1.5C by October. This is probably a little aggressive but nonetheless gives confidence that we won't be seeing a positive ENSO for the peak. Accordingly, it depicts low shear basin-wide, coupled with above-average precipitation signals. Ocean temperatures have been above average most of this year, and forecasts show this should continue.
15-8-3 ACE 140 as a starting point?
Most intense Atlantic seasons by ACE index (since 1950) vs. February AMO value:
1) 2005: +0.06
2) 1995: -1.33
3) 2004: +0.71
4) 2017: +0.08
5) 1950: -0.12
6) 1961: -0.13
7) 1998: +0.46
8) 1999: -0.28
9) 1969: 0.98
10) 1996: -0.44
Mean February AMO: -0.001
2020: -1.30
So far, out of all the years listed, 2020 has by far the most negative AMO value in February. Only 1995—which marked the transition between long-term -AMO/+AMO regimes—had a similarly negative value. Based solely on these data, the odds in favour of a very active 2020 season do not appear to be especially great. Your numbers and ACE look quite reasonable at this stage. Anything more than a slightly-above-average season seems quite improbable at this stage. However, things can always change.
Klotzbach's AMO index has proven to be a pretty awful ACE predictor the past four seasons. It has consistently been negative, yet the Atlantic has had four consecutive above average seasons including a hyperactive season.
4 likes
NCSU B.S. in Meteorology Class of 2021. Tropical weather blogger at http://www.cyclonicfury.com. My forecasts and thoughts are NOT official, for official forecasts please consult the National Hurricane Center.
-
Shell Mound
- Category 5
- Posts: 2432
- Age: 33
- Joined: Thu Sep 07, 2017 3:39 pm
- Location: St. Petersburg, FL → Scandinavia
Re: 2020 Indicators: SST's / SAL / MSLP / Steering / Shear / Instability / Sat Images
CyclonicFury wrote:Shell Mound wrote:TropicalAnalystwx13 wrote:It's still early, but we have unanimous signals for at least an above average season, perhaps hyperactive. Westerly wind bursts across the equatorial Pacific have been replaced by easterlies, and the MJO looks unable to maintain a coherent signal across the Pacific to switch these winds. Subsurface ocean heat content is decreasing, and a large cold pool is progressing. We should see steady cooling of the ENSO over the next months, with La Nina arriving before the peak of the season. The CFS suggests Nino 3.4 temperatures around -1.5C by October. This is probably a little aggressive but nonetheless gives confidence that we won't be seeing a positive ENSO for the peak. Accordingly, it depicts low shear basin-wide, coupled with above-average precipitation signals. Ocean temperatures have been above average most of this year, and forecasts show this should continue.
15-8-3 ACE 140 as a starting point?
Most intense Atlantic seasons by ACE index (since 1950) vs. February AMO value:
1) 2005: +0.06
2) 1995: -1.33
3) 2004: +0.71
4) 2017: +0.08
5) 1950: -0.12
6) 1961: -0.13
7) 1998: +0.46
8) 1999: -0.28
9) 1969: 0.98
10) 1996: -0.44
Mean February AMO: -0.001
2020: -1.30
So far, out of all the years listed, 2020 has by far the most negative AMO value in February. Only 1995—which marked the transition between long-term -AMO/+AMO regimes—had a similarly negative value. Based solely on these data, the odds in favour of a very active 2020 season do not appear to be especially great. Your numbers and ACE look quite reasonable at this stage. Anything more than a slightly-above-average season seems quite improbable at this stage. However, things can always change.
Klotzbach's AMO index has proven to be a pretty awful ACE predictor the past four seasons. It has consistently been negative, yet the Atlantic has had four consecutive above average seasons including a hyperactive season.
Actually, based on the link I posted, the mean CSU-based ACE index was positive in ASO for three of the past four seasons (2018 being the sole exception):
2016: +0.20
2017: +0.16
2018: -0.80
2019: +0.90
These are the averages for the three months of ASO.
Anyway, aside from 2017, none of those years was hyperactive.
2020 may well be another slightly-above-average year like 2016, 2018, or 2019, not another 2005 or '17.
0 likes
CVW / MiamiensisWx / Shell Mound
The posts in this forum are NOT official forecasts and should not be used as such. They are just the opinion of the poster and may or may not be backed by sound meteorological data. They are NOT endorsed by any professional institution or STORM2K. For official information, please refer to products from the NHC and NWS.
-
Kingarabian

- S2K Supporter

- Posts: 16381
- Joined: Sat Aug 08, 2009 3:06 am
- Location: Honolulu, Hawaii
Re: 2020 Indicators: SST's / SAL / MSLP / Steering / Shear / Instability / Sat Images
Large scale rising motion is already concentrating over the entire Atlantic and the long range Euro is showing no interruptions through the first week of May.

Who knows if this branch will maintain itself into the summer but if it does, I would expect hurricane numbers to be on the higher side.
PC: Weathermodels.com
Who knows if this branch will maintain itself into the summer but if it does, I would expect hurricane numbers to be on the higher side.
PC: Weathermodels.com
6 likes
RIP Kobe Bryant
-
TheStormExpert
Re: 2020 Indicators: SST's / SAL / MSLP / Steering / Shear / Instability / Sat Images
Has anyone recently seen the Gulf of Mexico SST’s? They’re running a good bit above average especially in the Northern GoM. Considering several including Crown Weather are more worried for the Gulf Coast and Caribbean in terms of landfall risk is concerned it’s something to keep a real close eye on!
https://twitter.com/hurricanetrack/status/1242898308466606080
https://twitter.com/hurricanetrack/status/1242898308466606080
0 likes
-
NotSparta

- Professional-Met

- Posts: 1677
- Age: 24
- Joined: Fri Aug 18, 2017 8:24 am
- Location: Naples, FL
- Contact:
Re: 2020 Indicators: SST's / SAL / MSLP / Steering / Shear / Instability / Sat Images
Kingarabian wrote:Large scale rising motion is already concentrating over the entire Atlantic and the long range Euro is showing no interruptions through the first week of May.
https://i.imgur.com/BRc04e0.png
Who knows if this branch will maintain itself into the summer but if it does, I would expect hurricane numbers to be on the higher side.
PC: Weathermodels.com
Looks to be keen on a sinking branch around 120°E which would put the lid on a La Niña. Though, it is rather expansive and seems to not really favor an El Niño either
3 likes
This post was probably an opinion of mine, and in no way is official. Please refer to http://www.hurricanes.gov for official tropical analysis and advisories.
My website, with lots of tropical wx graphics, including satellite and recon: http://cyclonicwx.com
My website, with lots of tropical wx graphics, including satellite and recon: http://cyclonicwx.com

Re: 2020 Indicators: SST's / SAL / MSLP / Steering / Shear / Instability / Sat Images
I believe I mentioned this last year, but I think in regards to ENSO and its effects on the season, it's not even so much about is it positive or negative, but trend and the rate the trend is moving seem to me to have an overall effect.
I think if you gave an average citizen with no knowledge of hurricanes some basic tenets (like El Niño favors EPAC, La Niña favors Atlantic), told them about the 2005 Atlantic season and showed them some statistics, then asked them the question: What do you believe the ENSO state was in 2005? They would probably use the basic info they were given and say 2005 was a pretty decent Niña year.
2005 did end up going La Niña, but it trended that way steadily over the year, and didn't even post a La Niña trimonthly until the October-November-December period.
2018 is similar for the EPAC/CPAC. If you just looked at season statistics without consulting any ENSO statistics you'd probably assume there was a strong Niño in place
to help the season generate record breaking ACE. Nope.
2018 started the year at Niña values, and didn't have a Niño trimonthly until September-October-November.
It seems to me that years that transition at a slower, more steady pace can really favor boosting numbers for either basin depending on what way ENSO is leaning.
I'm going to watch over the next few weeks to see how ENSO state is evolving, how fast it seems to be evolving, and how ENSO modeling trends.
Also, just to note, I use 2005 and 2018 as extreme examples for the two different basins, I'm not calling for a season like that.
Another thing I want to mention real quick is there is currently quite a bit of heat content out in the Atlantic for March, more than usual. The area between 0-10°N and between S. America and Africa is running above average. There's currently more heat content there than this time in March 2005 and March 2017. 2010 looked decently comparable when I went through it. I'm on my phone right now so I can't do it, but I'm going to try to get on my computer tomorrow and post the graphics here for comparison.
3 likes
Solar Aquarian
Lunar Cancerian
 Sagittarian
Lunar Cancerian
-
Kingarabian
- S2K Supporter
- Posts: 16381
- Joined: Sat Aug 08, 2009 3:06 am
- Location: Honolulu, Hawaii
Re: 2020 Indicators: SST's / SAL / MSLP / Steering / Shear / Instability / Sat Images
NotSparta wrote:Kingarabian wrote:Large scale rising motion is already concentrating over the entire Atlantic and the long range Euro is showing no interruptions through the first week of May.
https://i.imgur.com/BRc04e0.png
Who knows if this branch will maintain itself into the summer but if it does, I would expect hurricane numbers to be on the higher side.
PC: Weathermodels.com
Looks to be keen on a sinking branch around 120°E which would put the lid on a La Niña. Though, it is rather expansive and seems to not really favor an El Niño either
Long range (into May) shows a sinking branch holding over the MC and the WPAC (120E-165E), but breaks down over the EPAC with rising air setting up from 120W to the ATL MDR. SPB in full effect.
3 likes
RIP Kobe Bryant
-
Shell Mound
- Category 5
- Posts: 2432
- Age: 33
- Joined: Thu Sep 07, 2017 3:39 pm
- Location: St. Petersburg, FL → Scandinavia
Re: 2020 Indicators: SST's / SAL / MSLP / Steering / Shear / Instability / Sat Images
TheStormExpert wrote:Has anyone recently seen the Gulf of Mexico SST’s? They’re running a good bit above average especially in the Northern GoM. Considering several including Crown Weather are more worried for the Gulf Coast and Caribbean in terms of landfall risk is concerned it’s something to keep a real close eye on!
https://twitter.com/hurricanetrack/status/1242898308466606080
This is a rather typical -AMO feature: warmest SSTA near the continental U.S. (subtropics, Gulf Coast, East Coast), relatively cooler SSTA in the Caribbean/MDR.
Anyway, those +SSTA do not guarantee significant homegrown development: most landfalling major hurricanes in the U.S. have historically developed in the MDR.
Last edited by Shell Mound on Thu Mar 26, 2020 6:09 am, edited 1 time in total.
0 likes
CVW / MiamiensisWx / Shell Mound
The posts in this forum are NOT official forecasts and should not be used as such. They are just the opinion of the poster and may or may not be backed by sound meteorological data. They are NOT endorsed by any professional institution or STORM2K. For official information, please refer to products from the NHC and NWS.
-
Shell Mound
- Category 5
- Posts: 2432
- Age: 33
- Joined: Thu Sep 07, 2017 3:39 pm
- Location: St. Petersburg, FL → Scandinavia
Re: 2020 Indicators: SST's / SAL / MSLP / Steering / Shear / Instability / Sat Images
NotSparta wrote:Kingarabian wrote:Large scale rising motion is already concentrating over the entire Atlantic and the long range Euro is showing no interruptions through the first week of May.
https://i.imgur.com/BRc04e0.png
Who knows if this branch will maintain itself into the summer but if it does, I would expect hurricane numbers to be on the higher side.
PC: Weathermodels.com
Looks to be keen on a sinking branch around 120°E which would put the lid on a La Niña. Though, it is rather expansive and seems to not really favor an El Niño either
Indeed. This would make a well-above-average Atlantic season quite improbable, as opposed to a near-to-slightly-above-average year, which is far more probable and realistic. Based on mean MEI data for ASO, seven of the top ten years for ACE (since 1950) featured La Niña for ASO (bolded). Clearly, so long as a +AMO in place, the stronger La Niña gets, the more intense a season peaks.
1) 2005: -0.081
2) 1995: -0.731
3) 2004: +0.3075
4) 2017: -0.4965
5) 1950: -0.838
6) 1961: -0.5275
7) 1998: -0.841
8) 1999: -1.3805
9) 1969: +0.902
10) 1996: -0.536
0 likes
CVW / MiamiensisWx / Shell Mound
The posts in this forum are NOT official forecasts and should not be used as such. They are just the opinion of the poster and may or may not be backed by sound meteorological data. They are NOT endorsed by any professional institution or STORM2K. For official information, please refer to products from the NHC and NWS.

-
cycloneye

- Admin

- Posts: 149730
- Age: 69
- Joined: Thu Oct 10, 2002 10:54 am
- Location: San Juan, Puerto Rico
Re: 2020 Indicators: SST's / SAL / MSLP / Steering / Shear / Instability / Sat Images
0 likes
Visit the Caribbean-Central America Weather Thread where you can find at first post web cams,radars
and observations from Caribbean basin members Click Here
and observations from Caribbean basin members Click Here
-
Shell Mound
- Category 5
- Posts: 2432
- Age: 33
- Joined: Thu Sep 07, 2017 3:39 pm
- Location: St. Petersburg, FL → Scandinavia
Re: 2020 Indicators: SST's / SAL / MSLP / Steering / Shear / Instability / Sat Images
According to CDAS SSTA data, daily SSTs in the MDR have been consistently above average since January 4—despite a ragingly +NAO in the same timeframe. As the NAO is likely to go negative over the next few weeks, SSTs in the MDR, if anything, may even warm at least a bit further, implying a three-month-long stretch of above-average SSTA. If these +SSTA can be maintained over the upcoming months, past the spring predictability barrier, then I would certainly start to contemplate a potentially hyperactive season, based on increased prospects of a +AMO, in addition to other (potentially) favourable indices, especially the -PDO and possible La Niña conditions.
Source: Tropical Tidbits (for SSTA data)
Source: Tropical Tidbits (for SSTA data)
2 likes
CVW / MiamiensisWx / Shell Mound
The posts in this forum are NOT official forecasts and should not be used as such. They are just the opinion of the poster and may or may not be backed by sound meteorological data. They are NOT endorsed by any professional institution or STORM2K. For official information, please refer to products from the NHC and NWS.
-
TropicalAnalystwx13
- Category 5
- Posts: 2109
- Age: 28
- Joined: Tue Jul 19, 2011 8:20 pm
- Location: Wilmington, NC
- Contact:
Re: 2020 Indicators: SST's / SAL / MSLP / Steering / Shear / Instability / Sat Images
Shell Mound wrote:TropicalAnalystwx13 wrote:It's still early, but we have unanimous signals for at least an above average season, perhaps hyperactive. Westerly wind bursts across the equatorial Pacific have been replaced by easterlies, and the MJO looks unable to maintain a coherent signal across the Pacific to switch these winds. Subsurface ocean heat content is decreasing, and a large cold pool is progressing. We should see steady cooling of the ENSO over the next months, with La Nina arriving before the peak of the season. The CFS suggests Nino 3.4 temperatures around -1.5C by October. This is probably a little aggressive but nonetheless gives confidence that we won't be seeing a positive ENSO for the peak. Accordingly, it depicts low shear basin-wide, coupled with above-average precipitation signals. Ocean temperatures have been above average most of this year, and forecasts show this should continue.
15-8-3 ACE 140 as a starting point?
Most intense Atlantic seasons by ACE index (since 1950) vs. February AMO value:
1) 2005: +0.06
2) 1995: -1.33
3) 2004: +0.71
4) 2017: +0.08
5) 1950: -0.12
6) 1961: -0.13
7) 1998: +0.46
8) 1999: -0.28
9) 1969: 0.98
10) 1996: -0.44
Mean February AMO: -0.001
2020: -1.30
So far, out of all the years listed, 2020 has by far the most negative AMO value in February. Only 1995—which marked the transition between long-term -AMO/+AMO regimes—had a similarly negative value. Based solely on these data, the odds in favour of a very active 2020 season do not appear to be especially great. Your numbers and ACE look quite reasonable at this stage. Anything more than a slightly-above-average season seems quite improbable at this stage. However, things can always change.
Klotzbach's AMO index puts far too much stock in cold waters in the vicinity of Greenland. As you pointed out in your last post, waters in the MDR have been above average since the first few days of January. The CFS projects basin-wide warmth continuing, albeit with the warmest anomalies focused in the subtropics like we've seen the past several years. That shouldn't hinder tropical activity if combined with a favorable upper-level pattern (like we saw in 2017 and even to a lesser extent in 16/18/19). If anything, it increases the chances of a destructive year since those warm anomalies would strengthen the Bermuda high.
8 likes
-
TheStormExpert
Re: 2020 Indicators: SST's / SAL / MSLP / Steering / Shear / Instability / Sat Images
Shell Mound wrote:According to CDAS SSTA data, daily SSTs in the MDR have been consistently above average since January 4—despite a ragingly +NAO in the same timeframe. As the NAO is likely to go negative over the next few weeks, SSTs in the MDR, if anything, may even warm at least a bit further, implying a three-month-long stretch of above-average SSTA. If these +SSTA can be maintained over the upcoming months, past the spring predictability barrier, then I would certainly start to contemplate a potentially hyperactive season, based on increased prospects of a +AMO, in addition to other (potentially) favourable indices, especially the -PDO and possible La Niña conditions.
Source: Tropical Tidbits (for SSTA data)
Just yesterday you were saying no La Niña I’m pretty sure, why the sudden change?
0 likes
-
StruThiO

- Category 3

- Posts: 821
- Age: 26
- Joined: Fri Sep 15, 2017 5:51 am
- Location: Currently Portland, OR. Raised in Jax, FL.
Re: 2020 Indicators: SST's / SAL / MSLP / Steering / Shear / Instability / Sat Images
did someone say -nao?


0 likes
-
gatorcane

- S2K Supporter
- Posts: 23708
- Age: 48
- Joined: Sun Mar 13, 2005 3:54 pm
- Location: Boca Raton, FL
Re: 2020 Indicators: SST's / SAL / MSLP / Steering / Shear / Instability / Sat Images
Looking like it will be quite an active MDR between Lesser Antilles and Africa indeed. Note warmer waters in the Gulf. Will be watching for May/June development there.
0 likes
-
NotSparta
- Professional-Met
- Posts: 1677
- Age: 24
- Joined: Fri Aug 18, 2017 8:24 am
- Location: Naples, FL
- Contact:
Re: 2020 Indicators: SST's / SAL / MSLP / Steering / Shear / Instability / Sat Images
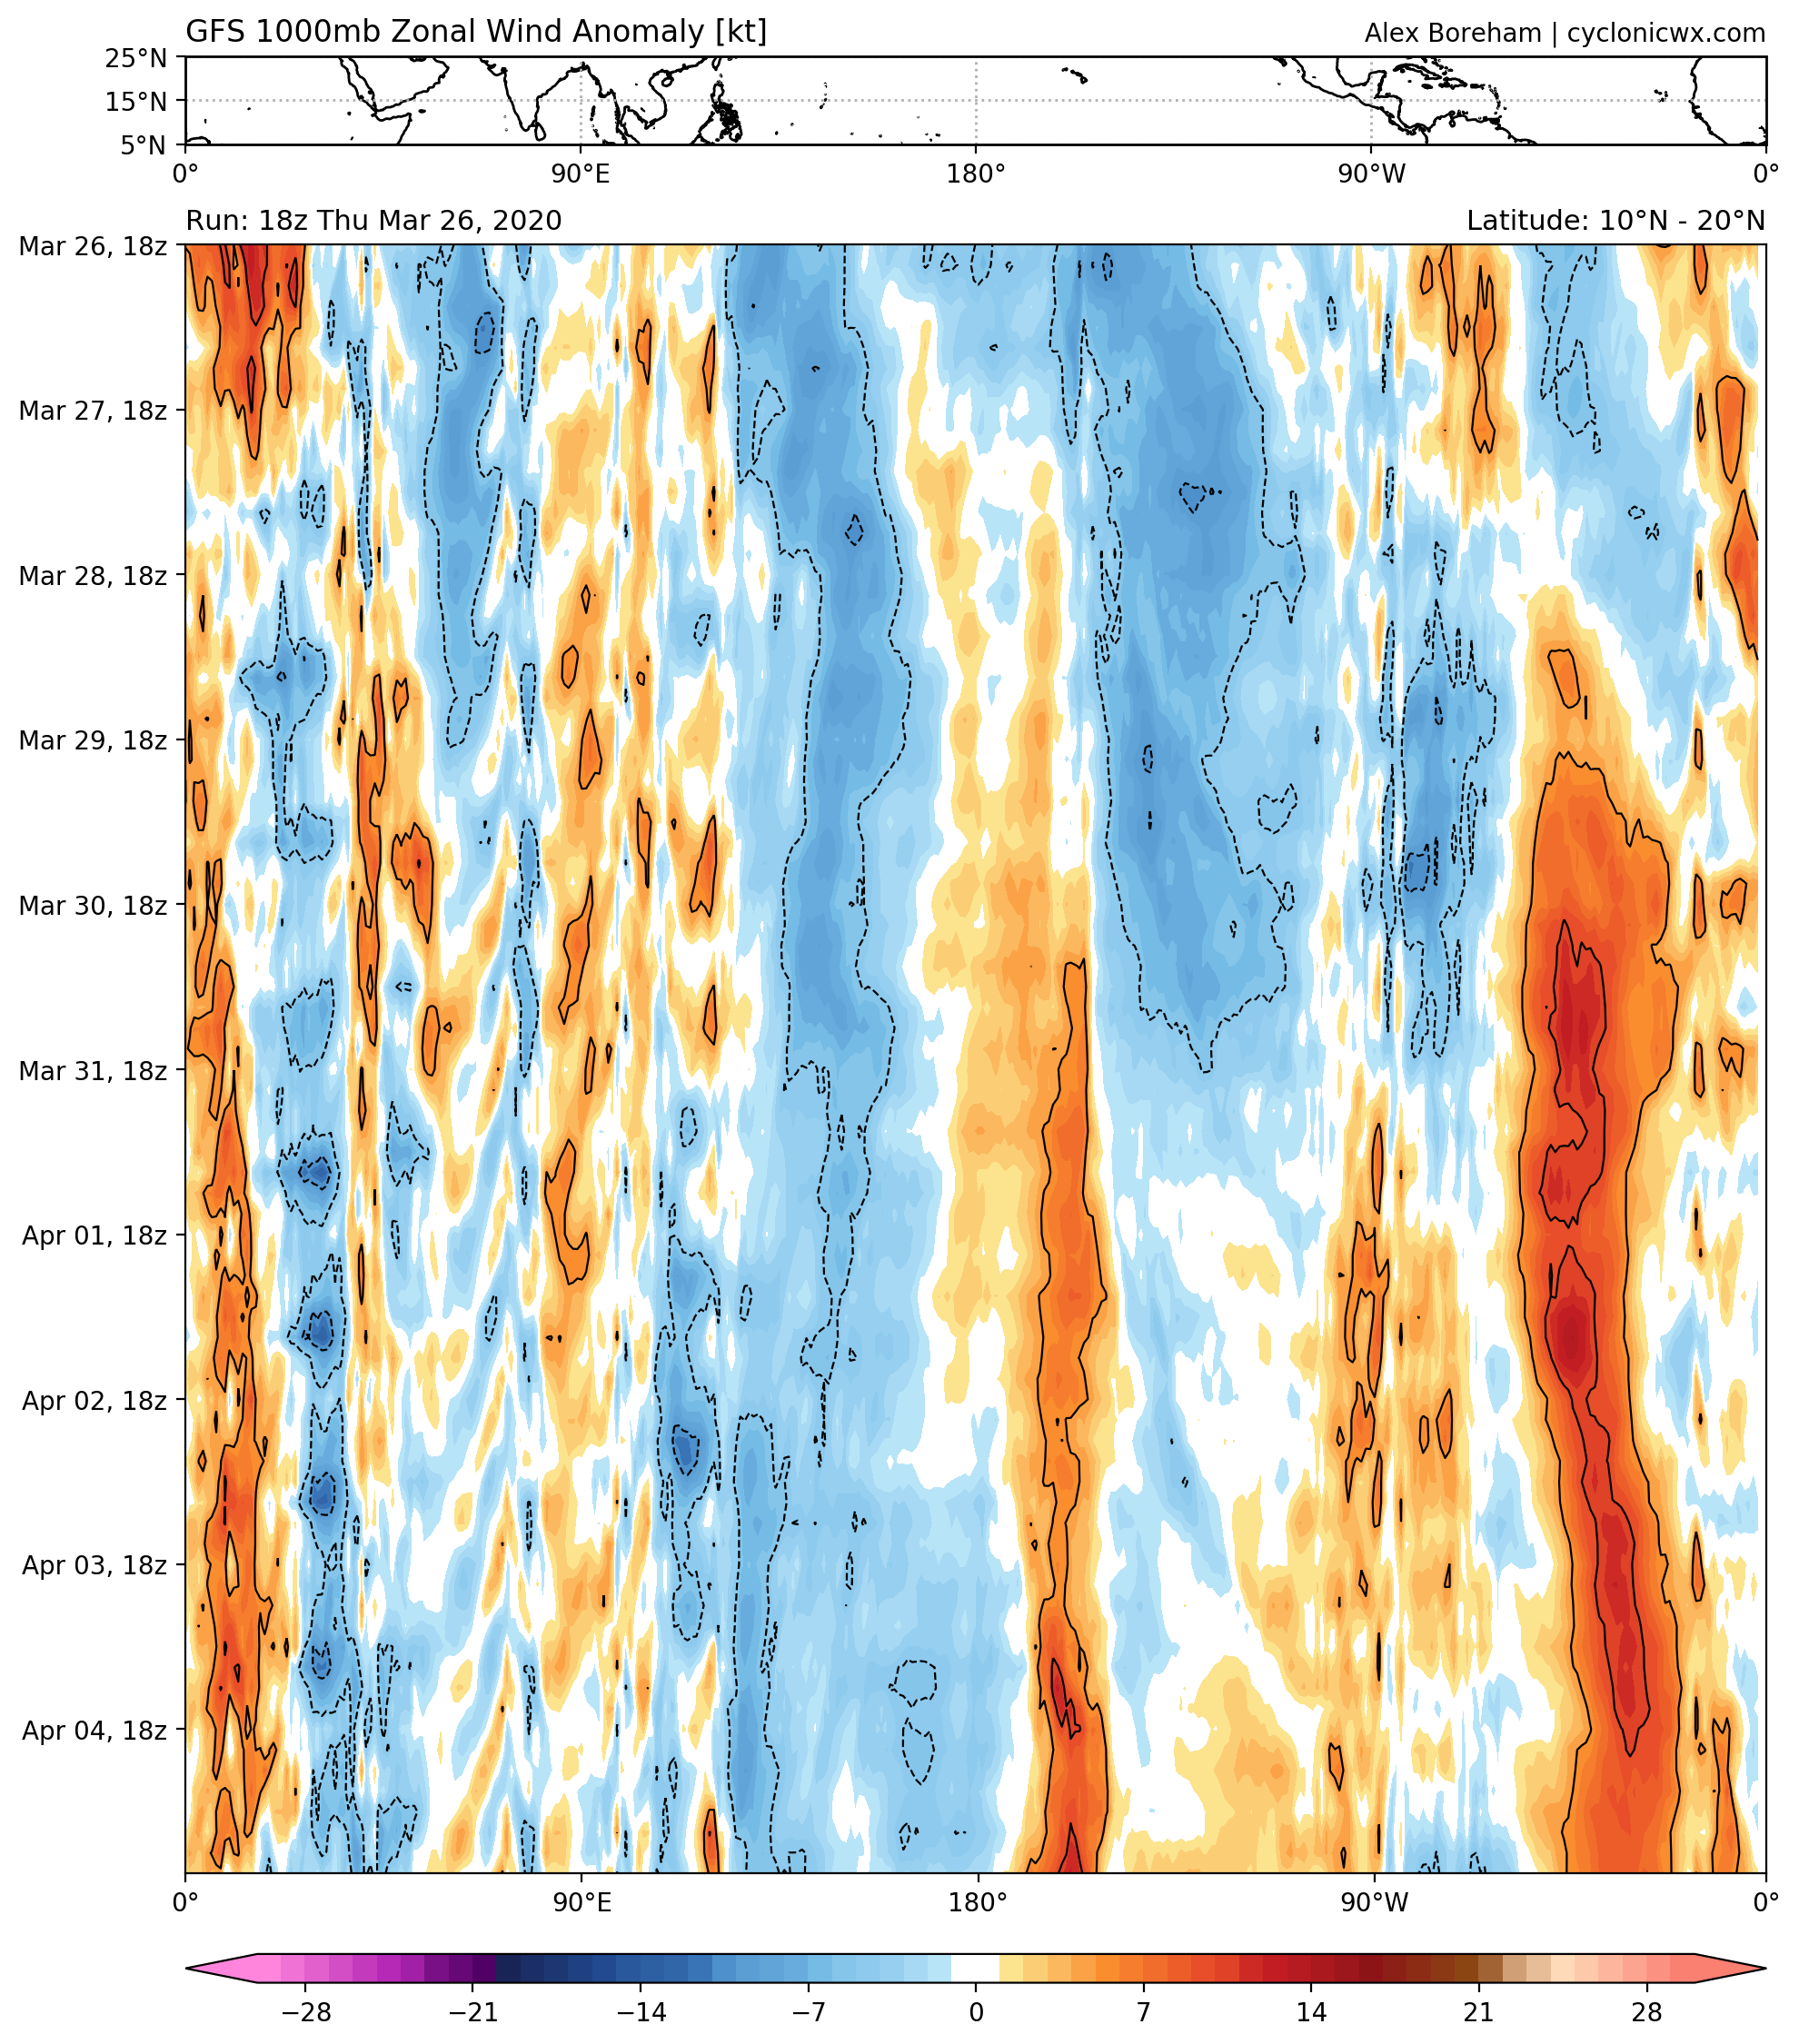
Hovmoller diagram from the 18z GFS today shows an extended period of strongly weakened trade winds coming up soon (as with previous runs). Appears that the MDR SSTAs may get some sort of bounce into April
4 likes
This post was probably an opinion of mine, and in no way is official. Please refer to http://www.hurricanes.gov for official tropical analysis and advisories.
My website, with lots of tropical wx graphics, including satellite and recon: http://cyclonicwx.com
My website, with lots of tropical wx graphics, including satellite and recon: http://cyclonicwx.com
-
Kingarabian
- S2K Supporter
- Posts: 16381
- Joined: Sat Aug 08, 2009 3:06 am
- Location: Honolulu, Hawaii
Re: 2020 Indicators: SST's / SAL / MSLP / Steering / Shear / Instability / Sat Images
Off topic but this thread has the 2020 hurricane season looking like:

7 likes
RIP Kobe Bryant
Who is online
Users browsing this forum: bird and 252 guests