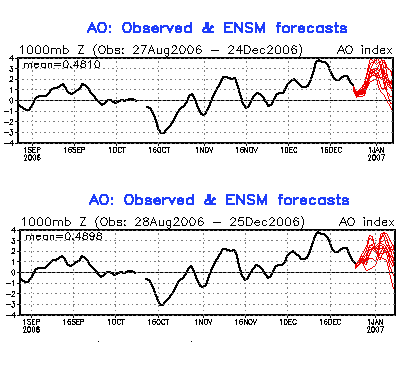
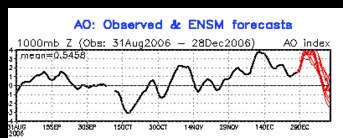
Evidence for a regime change in the AO is continuing to mount. The NCEP ensembles continue to show a splitting of the vortex. The GFS ensembles are in good agreement for a falling AO during the first week in January. By early January, the ECMWF is forecasting that warmer than normal readings near the North Pole will have descended to around 7.5 mb.
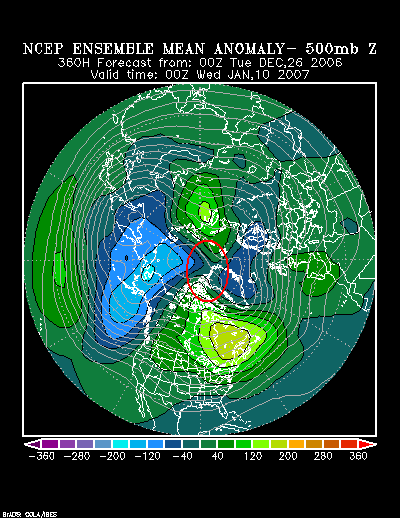
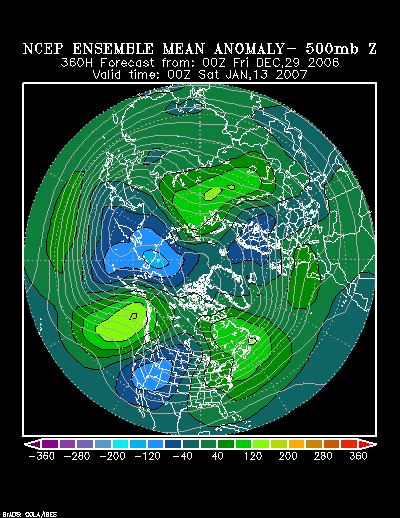
As the perpetual AO+ regime of 2006-07 finally falls apart in the January 10-20, 2007 timeframe, historic evidence suggests that one piece will head to western or northern Europe. The other larger piece could either languish near its current position or move slowly toward Asia. The latest run of the NCEP ensembles forecasts that it will slowly drift toward Asia. The 12/23 run of the GSM also may have hinted at such a prospect given its forecast temperature anomalies.
At the same time, the latest NCEP ensembles suggest that the development of a strongly negative NAO will probably not coincide with the demise of the AO+ regime.
If the above holds true, readings will merely trend to normal with occasional periods of somewhat below normal cold following the fall of the AO+ regime. More significant cold in which one or more days could see readings fall below 15° in New York City and Philadelphia might not reach the East for 10-14 days after the AO flips to negative. As a result, January will likely average warmer than normal in the East. ENSO climatology and past increased blockiness following the collapse of super long-duration AO+ regimes suggest that February would have the best chance to finish cooler than normal in the eastern half of the United States.
Although it might sound like heresy, I believe the slow development of a negative NAO rather than a crashing NAO might actually be a good development this time around. If the NAO were to crash immediately even as the largest piece of the once formidable polar vortex headed for Asia, the negative NAO would only be able to lock in place anomalously warm air that now covers much of Canada. In time, under such a scenario, a deep trough would be carved in the East, but readings would not turn severely cold. Once the block fell apart and the trough departed, a new blowtorch could then reignite.
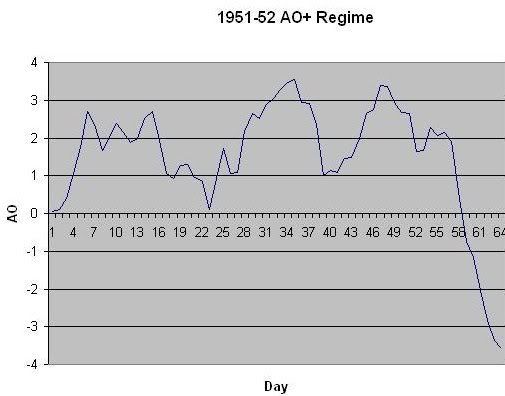
Winter 2001-02 provides a lesson. Although my invoking this horrid season may conjure the worst of sentiments, the lesson is an important one for illustrating my point that the slow development of blocking is probably better than an immediate tanking of the NAO.
In December 2001, a 27-day NAO+ regime that saw the NAO exceed +3 on several days ended abruptly on December 13. The NAO tanked. By December 16 the NAO had fallen below -3. Two days later, it stood below -4. All said, during the 15-day period ended December 30, 2001, the NAO averaged -3.714. At the same time, the PNA rose sharply. During the 10-day period ended January 1, 2002, the PNA averaged +2.949.
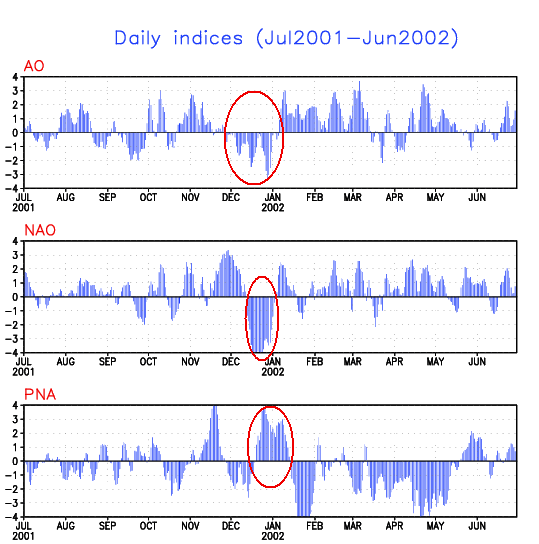
In response to the dramatic blocking that developed, a trough reached California on December 20, weakened in the southern Plains on December 22, then rapidly amplified beginning on December 23 as it moved eastward. During the December 26-January 3 period, the East was covered by a deep trough.

Temperatures averaged colder than normal, especially from the Mid-Atlantic region southward.

Readings were not extreme. Select data for mean temperature, highest temperature, and lowest temperature follow for select cities.
Atlanta:
Mean: 35.8°
Highest: 62°
Lowest: 22°
Boston:
Mean: 30.7°
Highest: 39°
Lowest: 23°
Burlington:
Mean: 24.6°
Highest: 33°
Lowest: 15°
New York City:
Mean: 30.3°
Highest: 41°
Lowest: 20°
Philadelphia:
Mean: 30.1°
Highest: 44°
Lowest: 20°
Richmond:
Mean: 31.3°
Highest: 58°
Lowest: 17°
Washington, DC (DCA):
Mean: 31.4°
Highest: 47°
Lowest: 20°
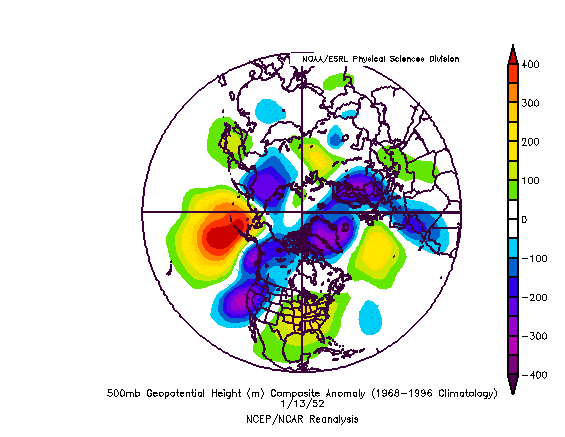
What happened was that Canada was filled with exceptionally warm air. Most of the cold air was located on the other side of the North Pole.
December 10-13, 2001 Temperature Anomalies:
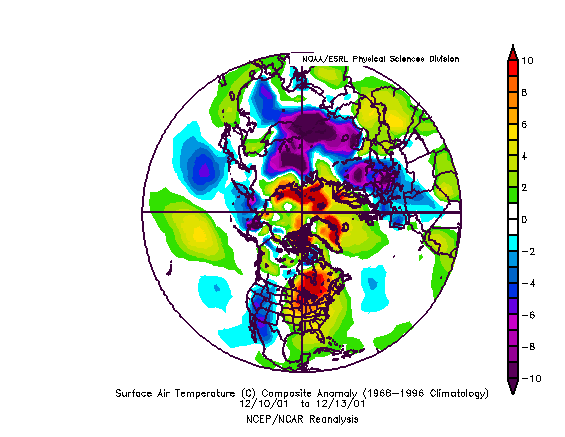
As the NAO was plunging, much of Canada was covered by readings of 10° or more above normal. On December 20, such anomalous warmth was centered mainly from the Hudson Bay/James Bay eastward. By December 23, much of Canada was again covered by such warmth. Hence, when the deep trough developed in response to the extreme block, only modest cold occurred. The colder air, though not extreme, swept across Lakes Erie and Ontario and created a historic lake effect snowstorm in the December 24-28, 2001 timeframe. Buffalo was buried under
82.3” of snow.
By January 3, 2002, another area of excessive warmth began building in western Canada. By January 6, much of Canada and the northern United States was again covered by much above normal temperatures. Later in January following the fading of another negative NAO event and collapse of the PNA to levels as low as -5.502, extreme warmth developed in the East.
Highest readings in the January 26-February 1, 2002 timeframe included:
Atlanta: 78°
Boston: 65°
Burlington: 51°
New York City: 69°
Philadelphia: 72°
Richmond: 81°
Washington, DC (DCA): 77° (two days)
January 2002 proved warmer than normal across much of the United States:

Afterward, tsunamis of warmth periodically swept across the United States. Winter 2001-02 proved very warm, as a whole.

As a result, seasonal snowfall wound up much below normal.
Albany: 47.4”
Baltimore: 2.3”
Boston: 15.1”
Burlington: 56.2”
Chicago: 31.1”
Montreal: 68.3” (173.2 cm)
New York City: 3.5”
Philadelphia: 4.0”
Providence: 11.6”
Toronto: 29.9” (76.0 cm)
Washington, DC:
…DCA: 3.2”
…IAD: 2.6”
Worcester: 43.6”
Conclusion:
In sum, I remain on board for a pattern change in the January 10-20 timeframe and the absence of strong blocking at the time the pattern change takes place is not necessarily a bad thing. The gradual development of blocking will allow time for colder air to begin filling Canada, so the outcome could differ from the nightmare of Winter 2001-02.
All said, I am not writing it off the pattern change nor am I canceling winter. Once the pattern change takes place, readings will likely return to near normal levels with possible somewhat cooler-than-normal days from time to time. Compared to the recent warmth, that will seem more frigid than it really is.
February could average cooler than normal in the East per increased blockiness and ENSO climatology. This would represent a dramatic change from Winter 2001-02, in which waves of warmth continued to regularly sweep the U.S. and Canada. As a result, there remains a prospect of snowfall winding up closer to normal than the hideous 2001-02 levels (except for Buffalo, which enjoyed a feast mainly on account of a single historic LES event).
 The posts in this forum are NOT official forecast and should not be used as such. They are just the opinion of the poster and may or may not be backed by sound meteorological data. They are NOT endorsed by any professional institution or