I see that term used many times when a new tropical wave is introduced after emerging Africa.Below is an example:
TROPICAL WAVE IS INTRODUCED ALONG 17W S OF 21N MOVING W 10 KT
BASED ON SATELLITE IMAGERY...SURFACE OBSERVATIONS...UPPER AIR
SOUNDINGS...(AND HOVMOLLER DIAGRAMS). WIDELY SCATTERED MODERATE
CONVECTION IS FROM 10N-17N BETWEEN 12W-17W.
If the pro mets can chim in and field this question I will learn about it and I am sure the majority of the members may want to know too what it is.
What are Hovmoller Diagrams?
Moderator: S2k Moderators
Forum rules

The posts in this forum are NOT official forecasts and should not be used as such. They are just the opinion of the poster and may or may not be backed by sound meteorological data. They are NOT endorsed by any professional institution or STORM2K. For official information, please refer to products from the National Hurricane Center and National Weather Service.
-
cycloneye

- Admin

- Posts: 148768
- Age: 69
- Joined: Thu Oct 10, 2002 10:54 am
- Location: San Juan, Puerto Rico
What are Hovmoller Diagrams?
0 likes
-
P.K.

- Professional-Met

- Posts: 5149
- Joined: Thu Sep 23, 2004 5:57 pm
- Location: Watford, England
- Contact:
Hovmoller diagrams are fun. Right I'll post an example of one from the NOAA ENSO update. http://www.cpc.ncep.noaa.gov/products/analysis_monitoring/enso_update/ssttlon5_c.gif
It is a good way of displaying lots of data on a single diagram, in this case showing SSTs across a line in the Pacific over the period of a year.
It is a good way of displaying lots of data on a single diagram, in this case showing SSTs across a line in the Pacific over the period of a year.
0 likes
-
brunota2003

- S2K Supporter

- Posts: 9476
- Age: 35
- Joined: Sat Jul 30, 2005 9:56 pm
- Location: Stanton, KY...formerly Havelock, NC
- Contact:
http://serc.carleton.edu:81/introgeo/te ... oller.html
Even though P.K. beat me, here is another link
Even though P.K. beat me, here is another link
0 likes
-
wxman57

- Moderator-Pro Met

- Posts: 23133
- Age: 68
- Joined: Sat Jun 21, 2003 8:06 pm
- Location: Houston, TX (southwest)
You can follow an MJO from the Indian Ocean, across the Pacific, and into the Atlantic Basin using a Hovmoller diagram. Date goes from top to bottom, latitude from left to right. The blue streaks going from the upper left to the lower right are MJOs tracking eastward across the Pacific.
http://www.cpc.ncep.noaa.gov/products/p ... _order.gif
http://www.cpc.ncep.noaa.gov/products/p ... _order.gif
0 likes

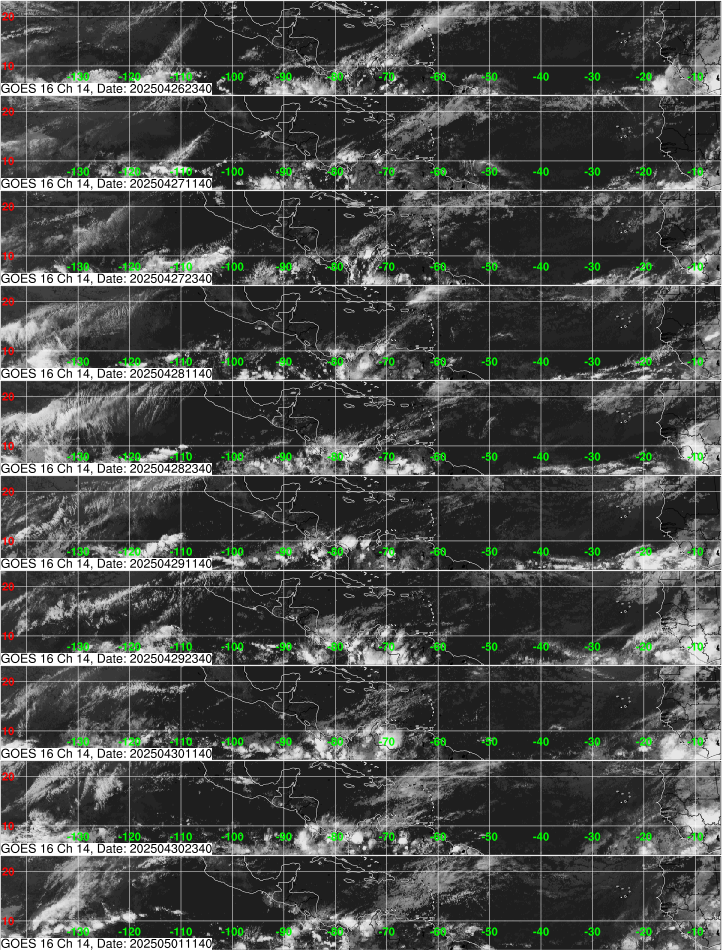
This is the sort of product that the discussion refers to:
http://www.nhc.noaa.gov/tafb_latest/m8hov1latest.gif
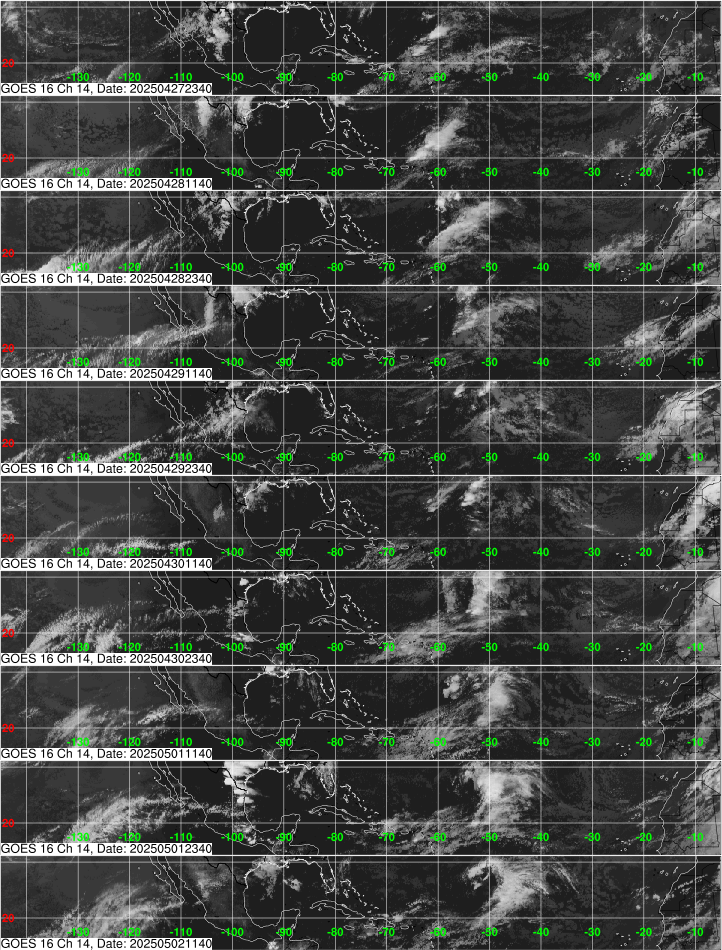
The diagrams are available for the other parts of the Atlantic basin as well:
http://www.nhc.noaa.gov/tafb_latest/gehov1latest.gif
http://www.nhc.noaa.gov/tafb_latest/gehov2latest.gif
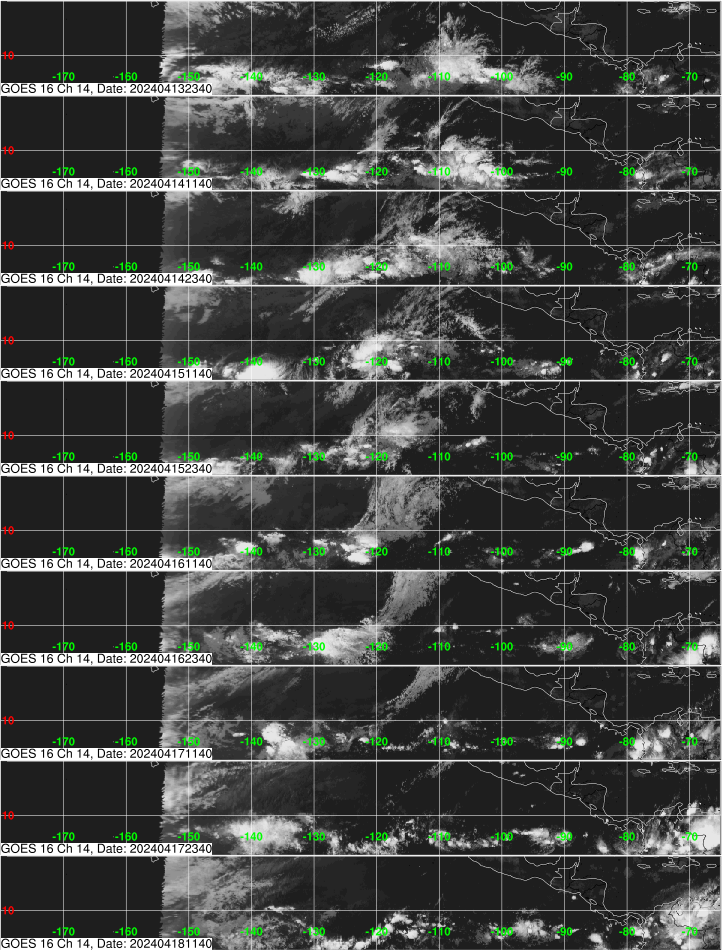
And also the Eastern Pacific:
http://www.nhc.noaa.gov/tafb_latest/gwhov1latest.gif
http://www.nhc.noaa.gov/tafb_latest/m8hov1latest.gif
The diagrams are available for the other parts of the Atlantic basin as well:
http://www.nhc.noaa.gov/tafb_latest/gehov1latest.gif
http://www.nhc.noaa.gov/tafb_latest/gehov2latest.gif
And also the Eastern Pacific:
http://www.nhc.noaa.gov/tafb_latest/gwhov1latest.gif
0 likes
-
cycloneye
- Admin
- Posts: 148768
- Age: 69
- Joined: Thu Oct 10, 2002 10:54 am
- Location: San Juan, Puerto Rico
Thanks to all for the answers.
0 likes
Visit the Caribbean-Central America Weather Thread where you can find at first post web cams,radars
and observations from Caribbean basin members Click Here
and observations from Caribbean basin members Click Here
Who is online
Users browsing this forum: cycloneye and 47 guests