On 4/24, category 3 all the way to the coast of Louisiana now.
SST'S and Anomalies in Atlantic and Pacific
Moderator: S2k Moderators
Forum rules

The posts in this forum are NOT official forecasts and should not be used as such. They are just the opinion of the poster and may or may not be backed by sound meteorological data. They are NOT endorsed by any professional institution or STORM2K. For official information, please refer to products from the National Hurricane Center and National Weather Service.
-
WeatherEmperor
- S2K Supporter

- Posts: 4806
- Age: 41
- Joined: Thu Sep 04, 2003 2:54 pm
- Location: South Florida
skysummit wrote:Maximum Potential Intensity Map

On 4/24, category 3 all the way to the coast of Louisiana now.
Forgive me for asking this, but what exactly does that map show? Im a bit new to that.
<RICKY>
0 likes
-
Jim Hughes
- Category 3

- Posts: 825
- Joined: Sun Jul 24, 2005 1:52 pm
- Location: Martinsburg West Virginia
Ivan14 wrote:Well it looks like I was wrong La Nina looks as if she is back.
Not to sure why you think this way. It's DEAD...Over. ...DONE.
The recent strong to moderate positive SOI averages will also most likely be history soon. Although that will probably take until summertime because it takes a while to wipe clean a 90 day average.
Jim
0 likes
-
skysummit

- S2K Supporter
- Posts: 5305
- Age: 50
- Joined: Tue Aug 31, 2004 11:09 pm
- Location: Ponchatoula, LA
- Contact:
WeatherEmperor wrote:skysummit wrote:Maximum Potential Intensity Map
On 4/24, category 3 all the way to the coast of Louisiana now.
Forgive me for asking this, but what exactly does that map show? Im a bit new to that.
<RICKY>
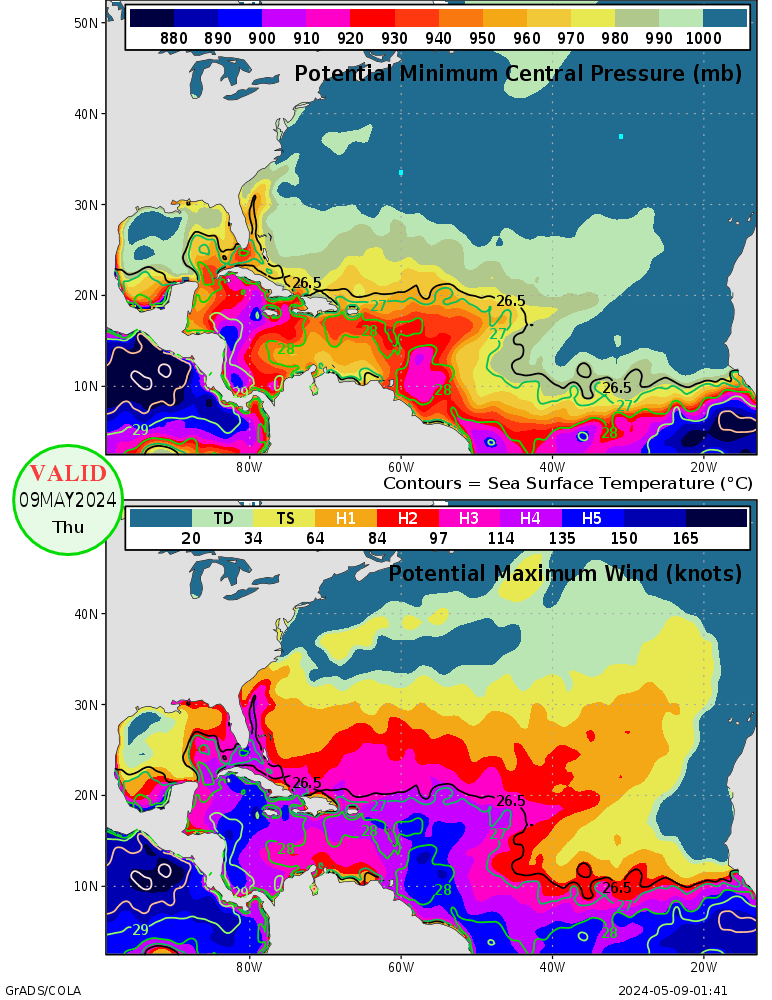
The first map shows the potential pressure the Gulf can support. The second map shows the potential hurricane intensity the Gulf can support....today. Just match the colors in the gulf with the key at the top of the map...you'll see the pink is "H3".
0 likes

Jim Hughes wrote:Ivan14 wrote:Well it looks like I was wrong La Nina looks as if she is back.
Not to sure why you think this way. It's DEAD...Over. ...DONE.
The recent strong to moderate positive SOI averages will also most likely be history soon. Although that will probably take until summertime because it takes a while to wipe clean a 90 day average.
Jim
Well the pool off cool water in the Pacific has spreed. The conditions in the U.S. that are usually around in a La Nina such as dryer conditions in the southeast are around. I am no expert tough. It sounds like you know alot more then me about the weather so I respect your opinion.
0 likes
-
CHRISTY
skysummit wrote:WeatherEmperor wrote:skysummit wrote:Maximum Potential Intensity Map
On 4/24, category 3 all the way to the coast of Louisiana now.
Forgive me for asking this, but what exactly does that map show? Im a bit new to that.
<RICKY>
The first map shows the potential pressure the Gulf can support. The second map shows the potential hurricane intensity the Gulf can support....today. Just match the colors in the gulf with the key at the top of the map...you'll see the pink is "H3".
ok so h1 h2 h3 h4 h5 mean cat1 cat2 cat3 and so on?
0 likes
-
skysummit
- S2K Supporter
- Posts: 5305
- Age: 50
- Joined: Tue Aug 31, 2004 11:09 pm
- Location: Ponchatoula, LA
- Contact:
CHRISTY wrote:skysummit wrote:WeatherEmperor wrote:skysummit wrote:Maximum Potential Intensity Map
On 4/24, category 3 all the way to the coast of Louisiana now.
Forgive me for asking this, but what exactly does that map show? Im a bit new to that.
<RICKY>
The first map shows the potential pressure the Gulf can support. The second map shows the potential hurricane intensity the Gulf can support....today. Just match the colors in the gulf with the key at the top of the map...you'll see the pink is "H3".
ok so h1 h2 h3 h4 h5 mean cat1 cat2 cat3 and so on?
Yup....I guess they mean "Hurricane 1, Hurricane 2, and so on. If this is incorrect, please someone correct me.
0 likes
-
CHRISTY


Maximum Potential Hurricane IntensityWeatherEmperor wrote:skysummit wrote:Maximum Potential Intensity Map
On 4/24, category 3 all the way to the coast of Louisiana now.
Forgive me for asking this, but what exactly does that map show? Im a bit new to that.
<RICKY>
The maps display potential minimum pressure and maximum winds, calculated according to a method developed by Dr. Kerry Emanuel. Dissipative heating is handled according to a method described in Bister and Emanuel (1998). The maps are based on data from the 00Z global operational analysis from NCEP for the date shown on the plot. The top panel shows the potential minimum central pressure for a hurricane at any given location (in millibars). Only values less than 1000mb are shaded. Cyan squares indicate grid points where the algorithm failed to converge. Also shown are the sea surface temperatures (°C). The bottom panel shows the potential maximum wind speed expressed in terms of the type and severity of storm they would represent (TD = Tropical Depression, TS = Tropical Storm, H1-H5 = Hurricanes of category 1-5 on the Saffir-Simpson scale).
This is from the website.
0 likes
-
HurricaneHunter914
- Category 5

- Posts: 4439
- Age: 32
- Joined: Fri Mar 10, 2006 7:36 pm
- Location: College Station, TX
-
wxwatcher91
- Category 5
- Posts: 1606
- Joined: Wed Jul 06, 2005 2:43 pm
- Location: Keene, NH
- Contact:
-
SouthFloridawx
- S2K Supporter
- Posts: 8346
- Age: 47
- Joined: Tue Jul 26, 2005 1:16 am
- Location: Sarasota, FL
- Contact:


-
Scorpion
-
HurricaneHunter914
- Category 5
- Posts: 4439
- Age: 32
- Joined: Fri Mar 10, 2006 7:36 pm
- Location: College Station, TX
-
Weatherfreak000
Who is online
Users browsing this forum: No registered users and 88 guests