


The first few examples I have are all from QuikSCAT, which as we know has sadly passed away...but I also found an example in microwave (MIMIC to be specific) imagery (with Hurricane Igor) and depending on what Hurricane Karl does over the next few hours, perhaps IR imagery as well (and both look very similar to the QuikSCAT images).
Here is how I will break this down, I will post an image that has not been edited, then will post a link to an edited version of the image showing what I am referring to...I am calling this the "Hook" effect (I suppose
Okay, this is an image from 2123 UTC (5:23 pm EDT) on the 18th of August 2009. This is Hurricane Bill over the Atlantic, during (or right before) a RI that was picked up by a NOAA Recon aircraft.

Same image as above, highlighting the "Hook" (used Paint, sorry if it is sucky! also, to keep the images down, I am only linking to the edited images)
http://img195.imageshack.us/img195/7643 ... 18hook.png
NHC Discussion at 1500 UTC (11 am EDT) Tues, Aug 18 (90 knots):
http://www.nhc.noaa.gov/archive/2009/al ... .013.shtml?
NHC Discussion at 2100 UTC (5 pm EDT) Tues, Aug 18 (95 knots):
http://www.nhc.noaa.gov/archive/2009/al ... .014.shtml?
Update from the NHC regarding the RI of Bill at 0030 UTC (8:30 pm EDT):
http://www.nhc.noaa.gov/archive/2009/al ... 0030.shtml?
NHC Discussion at 0300 UTC (11 pm EDT Aug 18) Wed, Aug 19 (110 knots):
http://www.nhc.noaa.gov/archive/2009/al ... .015.shtml?
Main page: http://www.nhc.noaa.gov/archive/2009/BILL.shtml?
Hurricane Bill strengthened from 110 mph at 5 pm EDT to 125 mph by 8:30 pm EDT. Between 5 pm and 11 pm, the pressure dropped from 962 millibars to 952 millibars.
***Due to updates, this one is no longer before the RI I mentioned, but is actually afterwords***
The next example is Hurricane Felicia in the Eastern Pacific (again using QuikSCAT).
This is an image of Hurricane Felicia at 14:36 UTC on August 5, 2009.

Same image as above, with the hook painted in
http://img651.imageshack.us/img651/8141 ... i1hook.png
NHC Discussion at 1500 UTC (8 am PDT) on Tue, Aug 4 (40 knots):
http://www.nhc.noaa.gov/archive/2009/ep ... .003.shtml?
Special NHC Discussion at 1700 UTC (10 am PDT) Tue, Aug 4 (60 knots):
http://www.nhc.noaa.gov/archive/2009/ep ... .004.shtml?
NHC Discussion at 2100 UTC (2 pm PDT) Tue, Aug 4 (70 knots):
http://www.nhc.noaa.gov/archive/2009/ep ... .005.shtml?
NHC Discussion at 0300 UTC (8 pm PDT Tue, Aug 4) Wed Aug 5 (85 knots):
http://www.nhc.noaa.gov/archive/2009/ep ... .006.shtml?
Main page: http://www.nhc.noaa.gov/archive/2009/FELICIA.shtml?
Hurricane Felicia strengthened from 80 mph at 2 pm PDT to 100 mph at 8 pm PDT. Between 2 pm and 8 pm, the pressure dropped from 985 millibars to 975 millibars. Please note that the image, due to QuikSCAT only taking so many in a day, was actually taken during a period of RI, versus before it...but I believe it still is worth adding on. (Due to updates...this images was taken the next day)
*** ***
The next system is Hurricane Fred, once again back in the Atlantic. I have two images for Hurricane Fred, and will post both.
The first image is from Sept 8 at 20:37 UTC.

Same as above, with the beginning of the hook painted
http://img186.imageshack.us/img186/448/fredri1hook.png
The second image is from Sept 9 at 07:42 UTC.

(Please see the painted image, apparently imageshack deleted the non-painted one)
Same as above, with the very sharp hook painted in (perhaps the sharper the hook, the longer/stronger the RI will be?)
http://img821.imageshack.us/img821/7291/fredri2hook.png
NHC Discussion at 1500 UTC (11 am EDT) Tue, Sept 8 (55 knots):
http://www.nhc.noaa.gov/archive/2009/al ... .004.shtml?
NHC Discussion at 2100 UTC (5 pm EDT) Tue, Sept 8 (60 knots):
http://www.nhc.noaa.gov/archive/2009/al ... .005.shtml?
NHC Discussion at 0300 UTC (11 pm EDT Tue, Sept 8) Wed, Sept 9 (65 knots):
http://www.nhc.noaa.gov/archive/2009/al ... .006.shtml?
NHC Discussion at 0900 UTC (5 am EDT) Wed, Sept 9 (90 knots):
http://www.nhc.noaa.gov/archive/2009/al ... .007.shtml?
NHC Discussion at 1500 UTC (11 am EDT) Wed, Sept 9 (105 knots):
http://www.nhc.noaa.gov/archive/2009/al ... .008.shtml?
Main page: http://www.nhc.noaa.gov/archive/2009/FRED.shtml?
The 12 hours between 11 pm EDT, Tue, Sept 8 and 11 am EDT, Wed, Sept 9 had an increase of wind speed from 75 mph to 120 mph, or 45 mph. The pressure also fell from 987 mb to 958 mb during those times as well.
This next one is from Hurricane Guillermo in the Eastern Pacific.
This is an image of Hurricane Guillermo on August 14, 2009 at 14:04 UTC.

Same image, with the hook painted in
http://img19.imageshack.us/img19/5628/g ... rihook.png
NHC Discussion at 0900 UTC (2 am PDT) Fri, Aug 14 (65 knots):
http://www.nhc.noaa.gov/archive/2009/ep ... .008.shtml?
NHC Discussion at 1500 UTC (8 am PDT) Fri, Aug 14 (70 knots):
http://www.nhc.noaa.gov/archive/2009/ep ... .009.shtml?
NHC Discussion at 2100 UTC (2 pm PDT) Fri, Aug 14 (85 knots):
http://www.nhc.noaa.gov/archive/2009/ep ... .010.shtml?
NHC Discussion at 0300 UTC (8 pm PDT Fri, Aug 14) Sat, Aug 15 (85 knots):
http://www.nhc.noaa.gov/archive/2009/ep ... .011.shtml?
NHC Discussion at 0530 UTC (10:30 pm PDT Fri, Aug 14) Sat, Aug 15 (100 knots):
http://www.nhc.noaa.gov/archive/2009/ep ... .012.shtml?
Main Page: http://www.nhc.noaa.gov/archive/2009/GUILLERMO.shtml?
Not even going to try to show wind speed increases and pressure decreases with this one...it is getting very late and will have to cut things short!
Now we move onto 2010, where Hurricane Igor went through a period of RI. This will be represented by a 24 hour loop from CIMSS' MIMIC. I will only paste the link to the loop here, please look in the SE quadrant of the hurricane for the "hook"...it is not as easy to spot as it is on QuikSCAT, though...but it appears around 0900 UTC (this is from Sept 12). I think it only lasts a couple hours, but I'm not sure that the hooks on QuikSCAT were present through the entire RI process, just the beginning.
http://cimss.ssec.wisc.edu/tropic/real- ... 2hr_05.gif
Main Igor MIMIC page:
http://cimss.ssec.wisc.edu/tropic/real- ... npage.html
NHC Discussion at 0900 UTC (5 am EDT - 70 knots):
http://www.nhc.noaa.gov/archive/2010/al ... .016.shtml?
NHC Discussion at 1500 UTC (11 am EDT - 90 knots):
http://www.nhc.noaa.gov/archive/2010/al ... .017.shtml?
Special NHC Discussion at 1830 UTC (1:30 pm EDT - 115 knots):
http://www.nhc.noaa.gov/archive/2010/al ... .018.shtml?
I think that last one should be either 2:30 pm EDT or 1730 UTC...since it is +4 from EDT...but wrote down exactly what the NHC Discussion reads.
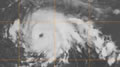
I have not looked through Hurricane Julia, so I am not sure if she showed a hook or not. However, pending what happens tonight with Hurricane Karl, it appeared he also showed a hook, but this time on Infrared Satellite images. This is also a little difficult to show, but will try my best.
Image from 03:40 UTC Fri, Sept 17

Same image, painted with a somewhat of a "hook"
http://img337.imageshack.us/img337/7939/karlrihook.jpg
Okay...maybe once I get imageshack to work again, I can get the two images posted
In conclusion, those are just some things I noticed. I would of looked at prior years if I knew where old data was archived, but all I have are the images I saved and then happened to notice a "coincidence" in, and that all were prior to a RI episode. I would love feedback on this, it took a couple hours to prepare and type up!


