
As an addition to the previous post here is the April/May/June activity of the 10 highest ACE seasons in the satellite era (since ~1960) not counting TDs:
1) 2005 = 0 TCs in April, 0 TCs in May, 2 TS in June (final numbers 28/15/7, 245 ACE)
2) 1995 = 0 TCs in April, 0 TCs in May, 1 C1 in June (final numbers 19/11/5, 227 ACE)
3) 2004 = 0 TCs in April, 0 TCs in May, 0 TCs in June (final numbers 15/9/6, 227 ACE)
4) 2017 = 1 TS in April, 0 TCs in May, 2 TS in June (final numbers 17/10/6, 225 ACE)
5) 1961 = 0 TCs in April, 0 TCs in May, 0 TCs in June (final numbers 12/8/5, 189 ACE)
6) 1998 = 0 TCs in April, 0 TCs in May, 0 TCs in June (final numbers 14/10/3, 182 ACE)
7) 2020 = 0 TCs in April, 2 TS in May, 2 TS in June (final numbers 30/14/7, 180 ACE)
8) 2003 = 0 TCs in April, 1 TS in April, 0 TCs in May, 1 TS in June (final numbers, 16/7/3, 177 ACE)
9) 1999 = 0 TCs in April, 0 TCs in May, 1 TS in June (final numbers 12/8/5, 177 ACE)
10) 1996 = 0 TCs in April, 0 TCs in May, 1 TS in June (final numbers 13/9/6, 166 ACE)
For the 10 most ACE-active satellite era seasons the average number of tropical storms for these months is as follows:
April = 0.1 TCs
May = 0.3 TCs
June = 0.9 TCs
April - June = 1.3 TCs
Only a single hurricane has formed before July during these seasons, namely category 1 hurricane Allison in 1995.
Getting a pre-July hurricane is not in any way a prerequisite for a busy season as you can see. On average one would expect roughly 1 TS before July based on these 10 seasons. Even if we don't get one just look at 2004 (#3), 1961 (#5) and 1998 (#6) which didn't have a single TC before July and still ended up as hyperactive seasons.
2024 Indicators: SST's, MSLP, Shear, SAL, Steering, Instability (Day 16+ Climate Models)
Moderator: S2k Moderators
Forum rules

The posts in this forum are NOT official forecasts and should not be used as such. They are just the opinion of the poster and may or may not be backed by sound meteorological data. They are NOT endorsed by any professional institution or STORM2K. For official information, please refer to products from the National Hurricane Center and National Weather Service.
Re: 2024 Indicators: SST's, MSLP, Shear, SAL, Steering, Instability (Day 16+ Climate Models)
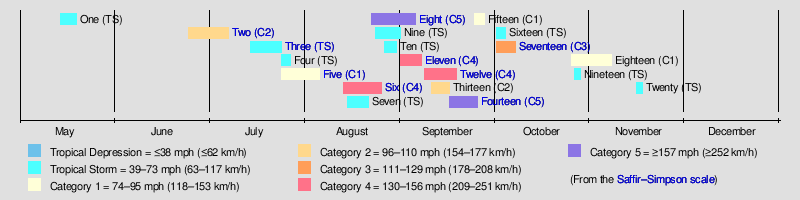
jlauderdal wrote:Category5Kaiju wrote:Just a friendly reminder that one of the most active NS seasons on record (most active ACE-wise) didn't really get going until late June/early July. In fact, assuming the talks that it could've produced more than 20 NSs given spotty records are true, then even if we were to get discount the May storm, then this season would've still ended up with at least 20 NSs.
https://upload.wikimedia.org/wikipedia/en/timeline/iwgq1m7qsr8z45t28iy0uk9g3fbxaex.png
TL;DR: even if we don't really see June activity this year, that wouldn't really tell us anything about how active the season will be later on. And given the -ENSO state, I'd wager that this season will extend into October and November.
There is little, if any, correlation between June activity and the final numbers. What we have is a discussion board about hurricanes, and naturally, the members want to see HURRICANES, especially intense hurricanes.
Whereas in the past that was true for me, I’d love nothing more than to see this year end up being a huge bust to the downside. So, I can say that in my case that my enjoyment of coming here is NOT because I want to see lots of hurricanes. It is because I LOVE wx forecasting discussions of all kinds and especially analyzing the relevant statistics. Sadly though, I don’t currently see a reasonable possibility of this season not being active. OTOH, I do see a reasonable chance for H landfalls to be limited in the CONUS, alone, (say 2 or fewer) especially IF we get a stronger rather than weaker La Niña (at least based on RONI) though I’m not outrightly predicting that.
Last edited by LarryWx on Fri Jun 07, 2024 7:53 am, edited 1 time in total.
5 likes
Personal Forecast Disclaimer:
The posts in this forum are NOT official forecasts and should not be used as such. They are just the opinion of the poster and may or may not be backed by sound meteorological data. They are NOT endorsed by any professional institution or storm2k.org. For official information, please refer to the NHC and NWS products.
The posts in this forum are NOT official forecasts and should not be used as such. They are just the opinion of the poster and may or may not be backed by sound meteorological data. They are NOT endorsed by any professional institution or storm2k.org. For official information, please refer to the NHC and NWS products.
-
cycloneye

- Admin

- Posts: 149347
- Age: 69
- Joined: Thu Oct 10, 2002 10:54 am
- Location: San Juan, Puerto Rico
Re: 2024 Indicators: SST's, MSLP, Shear, SAL, Steering, Instability (Day 16+ Climate Models)
kevin wrote:As an addition to the previous post here is the April/May/June activity of the 10 highest ACE seasons in the satellite era (since ~1960) not counting TDs:
1) 2005 = 0 TCs in April, 0 TCs in May, 2 TS in June (final numbers 28/15/7, 245 ACE)
2) 1995 = 0 TCs in April, 0 TCs in May, 1 C1 in June (final numbers 19/11/5, 227 ACE)
3) 2004 = 0 TCs in April, 0 TCs in May, 0 TCs in June (final numbers 15/9/6, 227 ACE)
4) 2017 = 1 TS in April, 0 TCs in May, 2 TS in June (final numbers 17/10/6, 225 ACE)
5) 1961 = 0 TCs in April, 0 TCs in May, 0 TCs in June (final numbers 12/8/5, 189 ACE)
6) 1998 = 0 TCs in April, 0 TCs in May, 0 TCs in June (final numbers 14/10/3, 182 ACE)
7) 2020 = 0 TCs in April, 2 TS in May, 2 TS in June (final numbers 30/14/7, 180 ACE)
8) 2003 = 0 TCs in April, 1 TS in April, 0 TCs in May, 1 TS in June (final numbers, 16/7/3, 177 ACE)
9) 1999 = 0 TCs in April, 0 TCs in May, 1 TS in June (final numbers 12/8/5, 177 ACE)
10) 1996 = 0 TCs in April, 0 TCs in May, 1 TS in June (final numbers 13/9/6, 166 ACE)
For the 10 most ACE-active satellite era seasons the average number of tropical storms for these months is as follows:
April = 0.1 TCs
May = 0.3 TCs
June = 0.9 TCs
April - June = 1.3 TCs
Only a single hurricane has formed before July during these seasons, namely category 1 hurricane Allison in 1995.
Getting a pre-July hurricane is not in any way a prerequisite for a busy season as you can see. On average one would expect roughly 1 TS before July based on these 10 seasons. Even if we don't get one just look at 2004 (#3), 1961 (#5) and 1998 (#6) which didn't have a single TC before July and still ended up as hyperactive seasons.
Hopefully, this information stops the already cancelled season chorus by some here and around the social media plataforms. Thanks kevin for posting this.
4 likes
Visit the Caribbean-Central America Weather Thread where you can find at first post web cams,radars
and observations from Caribbean basin members Click Here
and observations from Caribbean basin members Click Here
Re: 2024 Indicators: SST's, MSLP, Shear, SAL, Steering, Instability (Day 16+ Climate Models)
Atlantic hurricanes form in June only about once every 5 years – the lowest of any month of the hurricane season. The last hurricane anywhere in the Atlantic in June was Chris in 2012. Before that, it was Alex in 2010 and then Allison way back in 1995.
https://x.com/MichaelRLowry/status/1799076284573819373
0 likes
Re: 2024 Indicators: SST's, MSLP, Shear, SAL, Steering, Instability (Day 16+ Climate Models)
Texas and Florida have historically seen about twice as many named stormed impacts in June than the next closest states – North Carolina and Georgia. Texas in particular has seen the lion's share of June hurricanes since records began.
https://x.com/MichaelRLowry/status/1799078412264538166
0 likes
-
cycloneye
- Admin
- Posts: 149347
- Age: 69
- Joined: Thu Oct 10, 2002 10:54 am
- Location: San Juan, Puerto Rico
Re: 2024 Indicators: SST's, MSLP, Shear, SAL, Steering, Instability (Day 16+ Climate Models)
Comparisons of sst anomalies between 2005, 2010, 2020 and 2024.
https://x.com/DrKimWood/status/1799091134884696094
https://x.com/DrKimWood/status/1799091134884696094
5 likes
Visit the Caribbean-Central America Weather Thread where you can find at first post web cams,radars
and observations from Caribbean basin members Click Here
and observations from Caribbean basin members Click Here
-
cycloneye
- Admin
- Posts: 149347
- Age: 69
- Joined: Thu Oct 10, 2002 10:54 am
- Location: San Juan, Puerto Rico
Re: 2024 Indicators: SST's, MSLP, Shear, SAL, Steering, Instability (Day 16+ Climate Models)
1 likes
Visit the Caribbean-Central America Weather Thread where you can find at first post web cams,radars
and observations from Caribbean basin members Click Here
and observations from Caribbean basin members Click Here

-
Deshaunrob17
- Tropical Storm

- Posts: 211
- Joined: Tue Aug 18, 2020 7:49 am
Re: 2024 Indicators: SST's, MSLP, Shear, SAL, Steering, Instability (Day 16+ Climate Models)
Some people need to remember that this is the time of the year when we get the shorties in the subtropics . Development either happens in the subtropics or from CAG this time of the year. CAG is usually triggered by the (+) MJO which is now moving in.
The fact we’re not seeing the shorties is probably a sign that energy is going to be more focused in the tropics this year. This makes sense given the SST profile.
The fact we’re not seeing the shorties is probably a sign that energy is going to be more focused in the tropics this year. This makes sense given the SST profile.
7 likes
-
cycloneye
- Admin
- Posts: 149347
- Age: 69
- Joined: Thu Oct 10, 2002 10:54 am
- Location: San Juan, Puerto Rico
Re: 2024 Indicators: SST's, MSLP, Shear, SAL, Steering, Instability (Day 16+ Climate Models)
0 likes
Visit the Caribbean-Central America Weather Thread where you can find at first post web cams,radars
and observations from Caribbean basin members Click Here
and observations from Caribbean basin members Click Here
-
cycloneye
- Admin
- Posts: 149347
- Age: 69
- Joined: Thu Oct 10, 2002 10:54 am
- Location: San Juan, Puerto Rico
Re: 2024 Indicators: SST's, MSLP, Shear, SAL, Steering, Instability (Day 16+ Climate Models) June NMME run is up
NMME for JAS

For ASO.

The SST Anomalies for JAS and ASO.


For ASO.
The SST Anomalies for JAS and ASO.
1 likes
Visit the Caribbean-Central America Weather Thread where you can find at first post web cams,radars
and observations from Caribbean basin members Click Here
and observations from Caribbean basin members Click Here
-
JetFuel_SE

- Category 1

- Posts: 287
- Age: 26
- Joined: Thu Apr 30, 2020 3:57 pm
Re: 2024 Indicators: SST's, MSLP, Shear, SAL, Steering, Instability (Day 16+ Climate Models)
cycloneye wrote:kevin wrote:As an addition to the previous post here is the April/May/June activity of the 10 highest ACE seasons in the satellite era (since ~1960) not counting TDs:
1) 2005 = 0 TCs in April, 0 TCs in May, 2 TS in June (final numbers 28/15/7, 245 ACE)
2) 1995 = 0 TCs in April, 0 TCs in May, 1 C1 in June (final numbers 19/11/5, 227 ACE)
3) 2004 = 0 TCs in April, 0 TCs in May, 0 TCs in June (final numbers 15/9/6, 227 ACE)
4) 2017 = 1 TS in April, 0 TCs in May, 2 TS in June (final numbers 17/10/6, 225 ACE)
5) 1961 = 0 TCs in April, 0 TCs in May, 0 TCs in June (final numbers 12/8/5, 189 ACE)
6) 1998 = 0 TCs in April, 0 TCs in May, 0 TCs in June (final numbers 14/10/3, 182 ACE)
7) 2020 = 0 TCs in April, 2 TS in May, 2 TS in June (final numbers 30/14/7, 180 ACE)
8) 2003 = 0 TCs in April, 1 TS in April, 0 TCs in May, 1 TS in June (final numbers, 16/7/3, 177 ACE)
9) 1999 = 0 TCs in April, 0 TCs in May, 1 TS in June (final numbers 12/8/5, 177 ACE)
10) 1996 = 0 TCs in April, 0 TCs in May, 1 TS in June (final numbers 13/9/6, 166 ACE)
For the 10 most ACE-active satellite era seasons the average number of tropical storms for these months is as follows:
April = 0.1 TCs
May = 0.3 TCs
June = 0.9 TCs
April - June = 1.3 TCs
Only a single hurricane has formed before July during these seasons, namely category 1 hurricane Allison in 1995.
Getting a pre-July hurricane is not in any way a prerequisite for a busy season as you can see. On average one would expect roughly 1 TS before July based on these 10 seasons. Even if we don't get one just look at 2004 (#3), 1961 (#5) and 1998 (#6) which didn't have a single TC before July and still ended up as hyperactive seasons.
Hopefully, this information stops the already cancelled season chorus by some here and around the social media plataforms. Thanks kevin for posting this.
It won't stop anything, as people "season cancelled" 2005 during the gap in activity prior to Katrina.
3 likes
-
Category5Kaiju

- Category 5

- Posts: 4331
- Joined: Thu Dec 24, 2020 12:45 pm
- Location: Seattle and Phoenix
Re: 2024 Indicators: SST's, MSLP, Shear, SAL, Steering, Instability (Day 16+ Climate Models)
Deshaunrob17 wrote:Some people need to remember that this is the time of the year when we get the shorties in the subtropics . Development either happens in the subtropics or from CAG this time of the year. CAG is usually triggered by the (+) MJO which is now moving in.
The fact we’re not seeing the shorties is probably a sign that energy is going to be more focused in the tropics this year. This makes sense given the SST profile.
It's definitely a new pattern, at least relative to other recent seasons. Historically though, a lot of active seasons with strong deep tropical activity kind of acted like this, so in the grand scheme of things it's not new.
0 likes
Unless explicitly stated, all info in my posts is based on my own opinions and observations. Tropical storms and hurricanes can be extremely dangerous. Refer to an accredited weather research agency or meteorologist if you need to make serious decisions regarding an approaching storm.
-
skyline385

- Category 5
- Posts: 2728
- Age: 35
- Joined: Wed Aug 26, 2020 11:15 pm
- Location: Houston TX
Re: 2024 Indicators: SST's, MSLP, Shear, SAL, Steering, Instability (Day 16+ Climate Models)
Category5Kaiju wrote:Deshaunrob17 wrote:Some people need to remember that this is the time of the year when we get the shorties in the subtropics . Development either happens in the subtropics or from CAG this time of the year. CAG is usually triggered by the (+) MJO which is now moving in.
The fact we’re not seeing the shorties is probably a sign that energy is going to be more focused in the tropics this year. This makes sense given the SST profile.
It's definitely a new pattern, at least relative to other recent seasons. Historically though, a lot of active seasons with strong deep tropical activity kind of acted like this, so in the grand scheme of things it's not new.
When you say new pattern, do you mean weak systems spinning off the east coast? Because that was mostly a 2020 & 2021 thing even in recent years. The first storm in 2022 (Alex) spawned off a CAG on June 5 very similar to what we are looking at right now in the next few days. CAGs in June are also generally pretty common.
0 likes
-
Category5Kaiju
- Category 5
- Posts: 4331
- Joined: Thu Dec 24, 2020 12:45 pm
- Location: Seattle and Phoenix
Re: 2024 Indicators: SST's, MSLP, Shear, SAL, Steering, Instability (Day 16+ Climate Models)
skyline385 wrote:Category5Kaiju wrote:Deshaunrob17 wrote:Some people need to remember that this is the time of the year when we get the shorties in the subtropics . Development either happens in the subtropics or from CAG this time of the year. CAG is usually triggered by the (+) MJO which is now moving in.
The fact we’re not seeing the shorties is probably a sign that energy is going to be more focused in the tropics this year. This makes sense given the SST profile.
It's definitely a new pattern, at least relative to other recent seasons. Historically though, a lot of active seasons with strong deep tropical activity kind of acted like this, so in the grand scheme of things it's not new.
When you say new pattern, do you mean weak systems spinning off the east coast? Because that was mostly a 2020 & 2021 thing even in recent years. The first storm in 2022 (Alex) spawned off a CAG on June 5 very similar to what we are looking at right now in the next few days. CAGs in June are also generally pretty common.
Yeah, basically those kinds of weak spinups in the subtropics.
0 likes
Unless explicitly stated, all info in my posts is based on my own opinions and observations. Tropical storms and hurricanes can be extremely dangerous. Refer to an accredited weather research agency or meteorologist if you need to make serious decisions regarding an approaching storm.
-
cycloneye
- Admin
- Posts: 149347
- Age: 69
- Joined: Thu Oct 10, 2002 10:54 am
- Location: San Juan, Puerto Rico
Re: 2024 Indicators: SST's, MSLP, Shear, SAL, Steering, Instability (Day 16+ Climate Models)
2 likes
Visit the Caribbean-Central America Weather Thread where you can find at first post web cams,radars
and observations from Caribbean basin members Click Here
and observations from Caribbean basin members Click Here
-
jlauderdal
- S2K Supporter

- Posts: 7240
- Joined: Wed May 19, 2004 5:46 am
- Location: NE Fort Lauderdale
- Contact:
Re: RE: Re: 2024 Indicators: SST's, MSLP, Shear, SAL, Steering, Instability (Day 16+ Climate Models)
Lowry is the hurricane guru on channel 10 miami. Fun fact, max mayfield held the same position after retirement. Lowry is a storm surge expert so if you find yourself staring down surge in the forecast, pay attention to him.
0 likes
Re: 2024 Indicators: SST's, MSLP, Shear, SAL, Steering, Instability (Day 16+ Climate Models)
This record warmth extends even further W into the E Pac MDR, with a good portion of that area near 31C. This can best be seen on the maps for the last 2 weeks. It is a larger area of ~31C than in any part of the ATL.
How will this record E Pac warmth impact June/Jul in the ATL?
2 likes
Personal Forecast Disclaimer:
The posts in this forum are NOT official forecasts and should not be used as such. They are just the opinion of the poster and may or may not be backed by sound meteorological data. They are NOT endorsed by any professional institution or storm2k.org. For official information, please refer to the NHC and NWS products.
The posts in this forum are NOT official forecasts and should not be used as such. They are just the opinion of the poster and may or may not be backed by sound meteorological data. They are NOT endorsed by any professional institution or storm2k.org. For official information, please refer to the NHC and NWS products.
Re: 2024 Indicators: SST's, MSLP, Shear, SAL, Steering, Instability (Day 16+ Climate Models)
LarryWx wrote:
This record warmth extends even further W into the E Pac MDR, with a good portion of that area near 31C. This can best be seen on the maps for the last 2 weeks. It is a larger area of ~31C than in any part of the ATL.
How will this record E Pac warmth impact June/Jul in the ATL?
https://x.com/philklotzbach/status/1549409467204153344
See the above correlation map. That area doesn't even correlate with EPAC activity (or even negatively correlates with EPAC activity). I don't think it will have any impact on the Atlantic.
7 likes
-
cycloneye
- Admin
- Posts: 149347
- Age: 69
- Joined: Thu Oct 10, 2002 10:54 am
- Location: San Juan, Puerto Rico
Re: 2024 Indicators: SST's, MSLP, Shear, SAL, Steering, Instability (Day 16+ Climate Models)
3 likes
Visit the Caribbean-Central America Weather Thread where you can find at first post web cams,radars
and observations from Caribbean basin members Click Here
and observations from Caribbean basin members Click Here
Who is online
Users browsing this forum: mixedDanilo.E and 68 guests