As I continue to look at whether the NAO/PNA forecast (GFS ensembles) can add some value for the distant medium-range (generally 10-17 days out), I will continue to post my thoughts for that timeline. Needless to say, other factors are also considered.
In my discussion concerning the December 8-15 period, my major theme was a return of warmer weather to the East after a cool start. At this time, that idea remains on course. The December 16-22 period, much to the delight of a unique breed that calls itself “Warministas,” is likely to feature a continuation of that warmer regime. In fact, the objective analogs are downright fiery for a large part of the nation.
If one looks at the current guidance, there is no shelter from the flood of warmth that now predominates. The NCEP ensemble means show warmth. The objective analogs (GFS and ECM) are toasty. The historic experience with the forecast PNA and NAO are mild. Only the December 2 run of the GSM offers a near to below normal average for the East during the December 16-23 period. In my view, the evidence is overwhelmingly against the GSM idea. In fact, the anomaly might be the solely result of a late-period return of colder weather.
If such warmth materializes, look for the development of a pandemic of “Winter cancel!” cries. However, if one looks at historic experience with regard to the forecast NAO and PNA regime, snowier patterns have typically followed. Mid-December 1964, 1966, and 1977 have all featured similar patterns with respect to the forecast NAO and PNA. With the ECM objective analogs and GSM pointing to cold near the end of the 12/16-22 period and the GSM being very cold for the 12/23-30 timeframe, perhaps there will be hope for more snow in the East and Midwest following the 12/16-22 period as there are hints that the Subtropical jet could grow more active by that time. Moreover, past moderate El Niño winters have often focused their greatest snowfall and cold from late January through February. A return of snow and cold (for many, the coming of snow and cold) is something that will need to be examined later, as it is beyond the timeframe of this discussion.
In any case, late in the period or perhaps afterward, there will be a growing risk of colder air plunging into the western half of the U.S. and then spreading eastward but possibly not reaching the East until near or after 12/22 +/- a few days. It may be ushered in by a Miller B storm. Such a cold shot will likely prove transient (lasting 3-5 days) given the historic experience with patterns similar to the one forecast on the NCEP ensemble means and the PNA/NAO. Before then, “the genial temperature and brightness of the climate of the South” will cover a large part of the United States. The December 16-22 period will likely prove “more like spring than winter.”
My thinking for the average temperature anomalies during the 12/16-22 period is as follows:
Average Regional Temperature Anomalies (12/16-22):
Northeast: Above normal
Mid-Atlantic: Above normal
Southeast: Above normal
Great Lakes: Above to much above normal
Northern Plains: Above to much above normal
Central Plains: Above to much above normal
Southern Plains: Above normal
Pacific Northwest: Near normal
Southwest/Rest of West Coast: Near normal
For the major cities from Washington, DC to Boston, the 12/16-22 period is likely to feature:
- Nights generally in the 30s throughout the region with some 20s.
- Days mainly in the 40s but also 50s
- One or more days with a high temperature of 60° or above in Washington, DC
- One or more days with lows in the 20s throughout the region.
In the Southeast, Atlanta will likely see highs generally in the 50s. Lows should generally be in the 30s and 40s. Farther north, Richmond may also see a 60° or above day during the height of the warmth.
December 16-22, 2006 Thoughts: Moderate and Mild
Moderator: S2k Moderators
Forum rules
 The posts in this forum are NOT official forecast and should not be used as such. They are just the opinion of the poster and may or may not be backed by sound meteorological data. They are NOT endorsed by any professional institution or STORM2K.

The posts in this forum are NOT official forecast and should not be used as such. They are just the opinion of the poster and may or may not be backed by sound meteorological data. They are NOT endorsed by any professional institution or STORM2K.
-
donsutherland1
- S2K Analyst

- Posts: 2718
- Joined: Mon Sep 15, 2003 8:49 pm
- Location: New York
-
donsutherland1
- S2K Analyst
- Posts: 2718
- Joined: Mon Sep 15, 2003 8:49 pm
- Location: New York
At this point, the general idea of above normal temperatures for much of the nation for the 12/16-22 period as a whole continues to appear on course. Afterward, there could be a cooler and snowier period (3-5 days?) before milder weather returns.
From the initial discussion:
However, if one looks at historic experience with regard to the forecast NAO and PNA regime, snowier patterns have typically followed. Mid-December 1964, 1966, and 1977 have all featured similar patterns with respect to the forecast NAO and PNA. With the ECM objective analogs and GSM pointing to cold near the end of the 12/16-22 period and the GSM being very cold for the 12/23-30 timeframe, perhaps there will be hope for more snow in the East and Midwest following the 12/16-22 period as there are hints that the Subtropical jet could grow more active by that time. Moreover, past moderate El Niño winters have often focused their greatest snowfall and cold from late January through February.
For now, the big focus is on the magnitude of the warmth before cooler weather returns. For several days, the GFS ensembles have pointed to the warmth peaking in the East/Ohio Valley in the 12/17-20 timeframe. A closer look on that balmy period is in order.
December 11, 2006 0z NCEP Ensemble Mean 500 mb Height Anomalies: 192 hours:

December 11, 2006 0z NCEP Ensemble Mean 850 mb Temperature Anomalies: 192 hours:
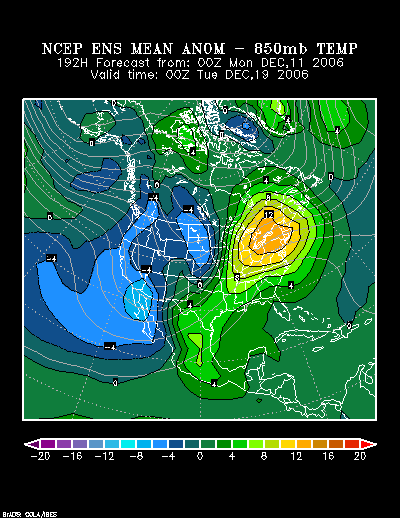
It should be noted that such extremes have not often occurred when the PNA or NAO were only modestly above or below zero. So, that's a caveat to watch as the period approaches. Indeed, the 12/11 0z run of the ECMWF offers a reason for caution.
Nonetheless, if those forecast anomalies are reasonably accurate, it would indicate some impressive warmth at the peak of the upcoming warm period toward which the pattern is now transitioning.
Past situations with similar Height Anomalies:

During those periods for which the above height anomalies were present, the highest temperature reached in select cities was:
December 24-27, 1964:
Atlanta: 72°
Boston: 60°
Detroit: 54°
New York City: 60°
Philadelphia: 68°
Richmond: 71°
Washington, DC: 72°
December 25-29, 1982:
Atlanta: 71°
Boston: 63°
Detroit: 64°
New York City: 65°
Philadelphia: 65°
Richmond: 74°
Washington, DC: 70°
December 22-24, 1990:
Atlanta: 73°
Boston: 67°
Detroit: 55°
New York City: 66°
Philadelphia: 66°
Richmond: 73°
Washington, DC: 71°
At this time, that kind of warmth should be seen as offering some insight into the potential magnitude of the 12/16-22 period at its warmest: 50s or better in Detroit, 60s in the Mid-Atlantic and possibly into southern New England, and possibly a 70° reading in parts of the Mid-Atlantic.
That extreme warmth is not yet a certainty (caveat and Euro noted above). However, the GFS ensembles have been very consistent in their run-to-run continuity, so the odds lean toward a day or two of excessive warmth to highlight the 12/16-22 timeframe. Overall, I retain good confidence in the general anomalies described at the beginning of this thread.
Finally, snowfall totals from January 1-April 30 for select cities following the three featured warm spells were:
Boston:
1965: 38.2"
1983: 27.2"
1991: 17.9"
New York City:
1965: 21.3"
1983: 24.2"
1991: 17.7"
Washington, DC (DCA):
1965: 16.4"
1983: 21.0"
1991: 5.1"
Overall, the sample size is very small, but the overall outcome was mixed.
From the initial discussion:
However, if one looks at historic experience with regard to the forecast NAO and PNA regime, snowier patterns have typically followed. Mid-December 1964, 1966, and 1977 have all featured similar patterns with respect to the forecast NAO and PNA. With the ECM objective analogs and GSM pointing to cold near the end of the 12/16-22 period and the GSM being very cold for the 12/23-30 timeframe, perhaps there will be hope for more snow in the East and Midwest following the 12/16-22 period as there are hints that the Subtropical jet could grow more active by that time. Moreover, past moderate El Niño winters have often focused their greatest snowfall and cold from late January through February.
For now, the big focus is on the magnitude of the warmth before cooler weather returns. For several days, the GFS ensembles have pointed to the warmth peaking in the East/Ohio Valley in the 12/17-20 timeframe. A closer look on that balmy period is in order.
December 11, 2006 0z NCEP Ensemble Mean 500 mb Height Anomalies: 192 hours:
December 11, 2006 0z NCEP Ensemble Mean 850 mb Temperature Anomalies: 192 hours:
It should be noted that such extremes have not often occurred when the PNA or NAO were only modestly above or below zero. So, that's a caveat to watch as the period approaches. Indeed, the 12/11 0z run of the ECMWF offers a reason for caution.
Nonetheless, if those forecast anomalies are reasonably accurate, it would indicate some impressive warmth at the peak of the upcoming warm period toward which the pattern is now transitioning.
Past situations with similar Height Anomalies:
During those periods for which the above height anomalies were present, the highest temperature reached in select cities was:
December 24-27, 1964:
Atlanta: 72°
Boston: 60°
Detroit: 54°
New York City: 60°
Philadelphia: 68°
Richmond: 71°
Washington, DC: 72°
December 25-29, 1982:
Atlanta: 71°
Boston: 63°
Detroit: 64°
New York City: 65°
Philadelphia: 65°
Richmond: 74°
Washington, DC: 70°
December 22-24, 1990:
Atlanta: 73°
Boston: 67°
Detroit: 55°
New York City: 66°
Philadelphia: 66°
Richmond: 73°
Washington, DC: 71°
At this time, that kind of warmth should be seen as offering some insight into the potential magnitude of the 12/16-22 period at its warmest: 50s or better in Detroit, 60s in the Mid-Atlantic and possibly into southern New England, and possibly a 70° reading in parts of the Mid-Atlantic.
That extreme warmth is not yet a certainty (caveat and Euro noted above). However, the GFS ensembles have been very consistent in their run-to-run continuity, so the odds lean toward a day or two of excessive warmth to highlight the 12/16-22 timeframe. Overall, I retain good confidence in the general anomalies described at the beginning of this thread.
Finally, snowfall totals from January 1-April 30 for select cities following the three featured warm spells were:
Boston:
1965: 38.2"
1983: 27.2"
1991: 17.9"
New York City:
1965: 21.3"
1983: 24.2"
1991: 17.7"
Washington, DC (DCA):
1965: 16.4"
1983: 21.0"
1991: 5.1"
Overall, the sample size is very small, but the overall outcome was mixed.
0 likes
-
wx247

- S2K Supporter

- Posts: 14279
- Age: 42
- Joined: Wed Feb 05, 2003 10:35 pm
- Location: Monett, Missouri
- Contact:
Thanks again for your updates. I love reading them and trying to decipher everything. Your hard work is appreciated!!!
0 likes
Personal Forecast Disclaimer:
The posts in this forum are NOT official forecast and should not be used as such. They are just the opinion of the poster and may or may not be backed by sound meteorological data. They are NOT endorsed by any professional institution or storm2k.org. For official information, please refer to the NHC and NWS products.
The posts in this forum are NOT official forecast and should not be used as such. They are just the opinion of the poster and may or may not be backed by sound meteorological data. They are NOT endorsed by any professional institution or storm2k.org. For official information, please refer to the NHC and NWS products.
-
Stephanie

- S2K Supporter
- Posts: 23843
- Age: 63
- Joined: Thu Feb 06, 2003 9:53 am
- Location: Glassboro, NJ
That forecast and the comparison to those other years makes me wonder if w'ere going to get "bombed" during the middle of winter ala 1983 and 1991. 
Remains to be seen. Anyway, it was in the mid to upper 50's today. The rest of the week promises more of the same here including rain from Wednesday through Friday.
Keep those forecasts coming don!
Remains to be seen. Anyway, it was in the mid to upper 50's today. The rest of the week promises more of the same here including rain from Wednesday through Friday.
Keep those forecasts coming don!
0 likes
Who is online
Users browsing this forum: No registered users and 99 guests