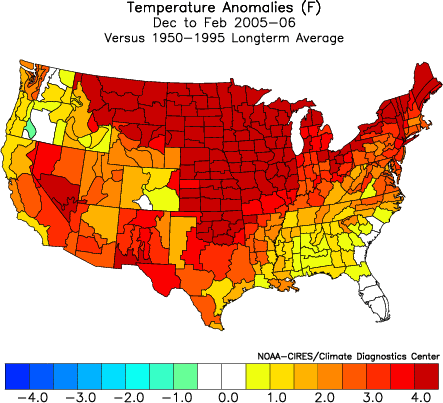
Temperature Snapshot:
• Northeast: Somewhat cooler than normal
• Mid-Atlantic: Somewhat cooler than normal
• Southeast: Near normal
• Ohio Valley: Somewhat cooler than normal to near normal
• Northern Plains: Near normal
• Central Plains: Near normal to somewhat warmer than normal
• Southern Plains: Warmer than normal
• West Coast/Pacific Northwest: Warmer than normal
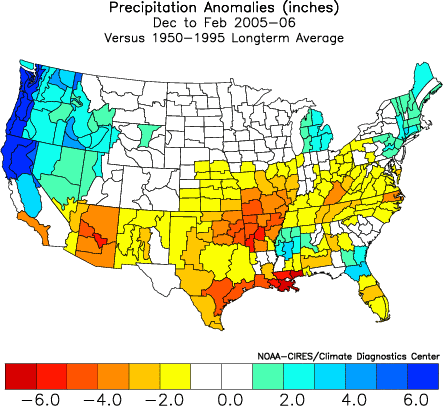
Precipitation Snapshot:
• Northeast: Near normal
• Mid-Atlantic: Near normal
• Southeast: Below normal to Near normal
• Ohio Valley: Near normal
• Northern Plains: Near normal
• Central Plains: Near normal
• Southern Plains: Below normal to near normal
• West Coast/Pacific Northwest: Above normal
Snowfall Estimates for Select Cities:
Baltimore: 20”-30”
Boston: 35”-45”
Burlington: 70”-80”
Chicago: 35”-45”
Cleveland: 80”-90”
New York City: 25”-35”
Philadelphia: 20”-30”
Pittsburgh: 40”-50”
Providence: 35”-45”
Richmond: 10”-15”
St. Louis: 16”-21”
Washington, DC: 18”-23”
ANALYSIS:
ENSO: Region 3.4 Anomalies vs. Region 1+2 Anomalies
Given the latest computer guidance and analogs, it appears likely that the December-March Region 3.4 anomaly will average between 0.00 and +0.50 while the December-March Region 1+2 anomaly will average < 0.00. Since 1950-51, 8 seasons have had such a profile. In such seasons, 7/8 (88%) cases saw the Central Plains and Southern Plains (including Texas) come out normal or warmer than normal. In 6/8 (75%) cases, the Central Plains were warmer than normal and in 5/8 (63%) cases, the Southern Plains were warmer than normal. In the Southeast (including Florida), 5/8 (63%) cases were warmer than normal and 7/8 (88%) were normal to warmer than normal. The other areas were relatively evenly divided between cold and warm anomalies.
However, once one factors in the Pacific Decadal Oscillation (PDO), one finds a clearer picture. The following applies for seasons where the PDO averaged > 0 during the December-March period:
Pacific Northwest: 75% warm
Rest of Pacific Coast: 75% warm
Northern Plains: 75% cool to normal
Central Plains: 75% normal to warm
Southern Plains (including Texas): 75% warm
Ohio Valley: 75% cool
Northeast: 100% cool
Mid-Atlantic: 100% cool
Southeast (including Florida): 50% normal
In such cases, wet anomalies are typically present across the Southeast and Mid-Atlantic states and the West Coast. Dry anomalies are typically present across the Deep South and Southwest.
In addition, 75% of those seasons saw a “Kocin-Uccellini snowstorm.”

Neutral ENSO Winters after Neutral ENSO Summers/Autumns:
Since 1950-51, there have been 14 such seasons. This data, especially when a PDO>0 is factored in, strongly mirrors the above conclusions, along the East Coast and West Coast. In addition, of the 7 seasons where the PDO averaged above 0.00, 5 (71%) saw a “Kocin-Uccellini snowstorm.”

ENSO Region Matches (September 2005 + Last 3 Months:
Such matches can help determine whether the most recent ENSO conditions are consistent with the longer-term ENSO situation that has prevailed and is likely for the coming winter.
The winters for the 10 most similar matches were:
1952-53
1960-61
1962-63
1966-67
1977-78
1980-81
1990-91
1992-93
2001-02
2003-04
As with the earlier ENSO scenarios, there is again consistency, especially when one factors in a PDO>0. 5/10 (50%) of these seasons saw at least one “Kocin-Uccellini snowstorm” while 4/5 (80%) of seasons that also included a PDO>0 saw such a snowstorm.

Additional Factors:
Winter 2005-06 will likely see the QBO average appreciably negative even as it could rise rapidly late in the winter. There were two seasons where the December-March QBO averaged -10 or below and the Region 3.4 anomaly ranged between 0.00 and +0.50: 1958-59 and 1981-82. Both featured cool anomalies in at least part of the East and warm ones in part of the West. Given that this supports the preponderance of the ENSO-PDO scenarios, the QBO does not necessarily suggest warmth in the East. That small sample of two is inconclusive with regard to snowfall with 1958-59 not supporting big snowfall but 1981-82 providing healthy snowfall. Hence, as it is not conclusive, the QBO is discounted with regard to the snowfall ideas.
The NAO could average negative for the winter. However, given the changes that took place in the methodology behind the data, confidence in this idea is lower than it might otherwise be.
Local Indicators:
Last year, the local data suggested that New England had the potential for a blockbuster winter. Unfortunately, this year, the local data suggests the potential for below normal to much below normal snowfall for New England. Some weight is given to these indicators given their performance last winter.
Historic snowfall climatology also argues for a drop off in Boston’s snowfall. Since 1891-92, Boston has seen 11 seasons with 70” or more snowfall. 5/11 (45%) have occurred beginning with 1992-93. For the 10 such seasons prior to 2004-05, just 1 (1992-93) was followed by another blockbuster season (1993-94: 96.3” following the 83.9” that fell in 1992-93). 6/10 (60%) saw less than 40” snowfall the following season. 3/10 (30%) saw 50” or more. As a result, the combination of the local indicators that pointed to Boston’s blockbuster winter last season and historic climatology both argue that 2005-06 probably won’t be a blockbuster season.
New York City’s Wetter Climate:
New York City’s Central Park has received 40” or more snowfall for 3 consecutive winters. That exceeds the former mark of 2. If New York City were to have a 4th consecutive such season, it would be arguably among the most significant weather events relative to climatology for some time.
Historic climatology strongly argues against a doubling of NYC’s earlier record. However, NYC has seen 5 consecutive 30” seasons (1880-81 through 1884-85). With a wetter climate—and it appears that the City has seen the development of such a climate—perhaps that might have translated into a greater chance of more 40” seasons.
Let’s take a closer look at NYC’s wetter climate:
Annual Precipitation:
1869-1969: 42.94”
1970-2004: 49.51”
Change: +15%
December-March Precipitation:
1869-70 through 1969-70: 13.86”
1970-71 through 2004-05: 15.55”
Change: +12%
The tendency for extremes on the wet side has also increased:
Annual Extremes:
• < 40” Precipitation:
1869-1969: 36% of years
1970-2004: 11% of years
• >50” or more Precipitation:
1869-1969: 12% of years
1970-2004: 37% of years
December-March Extremes:
• <12” Precipitation:
1869-70 through 1969-70: 26% of seasons
1970-71 through 2004-05: 23% of seasons
• >15” Precipitation:
1869-70 through 1969-70: 33% of seasons
1970-71 through 2004-05: 57% of seasons
Key Assumptions:
• Neutral ENSO
• Weak warm anomaly in ENSO Region 3.4
• Cool anomaly in ENSO Region 1+2
• PDO>0
• QBO: East
Historic Tidbit: The Severe Winter of 1740-41:
Extract from the records of John Bissell, Esq., Town Clerk of Bolton, Connecticut:
At Guilford, a sheep was in the winter buried in a storm of snow, and lay there ten weeks and three days, and came out alive. The spring came on very slowly; the beginning of March about half the people of the government had spent all their hay; and subsisted them by falling [felling] trees, giving out their Indian corn; and by reason of which scarcity a great number of cattle and horses died, and near half the sheep, and about two thirds of the goats.
Update:
If necessary, an update will be provided toward the end of November.
 The posts in this forum are NOT official forecast and should not be used as such. They are just the opinion of the poster and may or may not be backed by sound meteorological data. They are NOT endorsed by any professional institution or


