The December AO: An Ominous Signal

Winter Weather Discussion

Moderator: S2k Moderators

Forum rules

The posts in this forum are NOT official forecast and should not be used as such. They are just the opinion of the poster and may or may not be backed by sound meteorological data. They are NOT endorsed by any professional institution or STORM2K.

Help Support Storm2K
Message
Author
donsutherland1
S2K Analyst
S2K Analyst
Posts: 2718
Joined: Mon Sep 15, 2003 8:49 pm
Location: New York

#21 Postby donsutherland1 » Fri Dec 22, 2006 9:50 pm

When it comes to the continuing AO+ regime, it appears that toward the end of this month, some warming will be moving into the highest levels of atmosphere (1-2 mb). However, the 10 mb region will still remain anomalously cool through 12/29 per the ECMWF (from the Stratospheric Research Group FU Berlin):

Image

The area to the very right side of the two charts is approximately 85N to 90N. Vertically, the charts have been cropped with 10 mb at the bottom and 1 mb at the top. The two charts are the ECMWF forecast for 12/22 and 12/29.

The overall situation in this forecast calls for a slow decline in the AO. One is not likely to see a near-term collapse. A more rapid fall might commence later, but that will be beyond the timeframe of the ECMWF. One probably will see a more rapid decline commence toward the end of the first week in January or afterward. However, the AO+ regime appears likely to remain intact until the January 10-20 timeframe. Moreover, the GFS continues to show the vortex stretching out over time, but still relatively intact through its forecast horizon.

All said, at least as far as the AO is concerned, a pattern change in the January 10-20 period is probably more likely than something earlier. Moreover, it would not suprise me if the pattern change were preceded by a brief bout of much above normal readings given some of the ensemble guidance. Overall, warmer than normal temperatures appear likely through much of the USA through January 7 (the Southern Plains and Southeast might be a little cooler).
0 likes   

User avatar
jasons2k
Storm2k Executive
Storm2k Executive
Posts: 8245
Age: 51
Joined: Wed Jul 06, 2005 12:32 pm
Location: The Woodlands, TX

#22 Postby jasons2k » Sun Dec 24, 2006 10:35 am

Thanks again for your analysis Don!
0 likes   

donsutherland1
S2K Analyst
S2K Analyst
Posts: 2718
Joined: Mon Sep 15, 2003 8:49 pm
Location: New York

#23 Postby donsutherland1 » Tue Dec 26, 2006 6:36 pm

There's panic among the snow geese. At least it seems that way from a number of posts and threads that popped up overnight. With springlike weather, flowers scattered even into the Northeast, honey bees still present, and a dearth of snowfall, it might appear that way. Certainly the "perpetual" AO+ regime in place has continued to succeed in locking up the Arctic air. The ever more adamant insistence of the NCEP ensemble forecast for another blowtorch has further crushed hopes of a pattern change and, to some, that Winter 2006-07 can be salvaged.

But all hope is not lost.

First, as noted several days ago, I believed a blowtorch could precede any pattern change. The idea of a blowtorch is not a sudden development that leads me to argue against my idea of a pattern change in the January 10-20 timeframe.

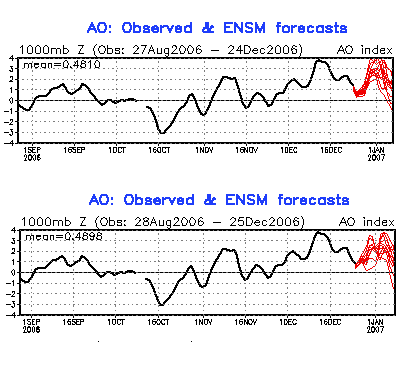
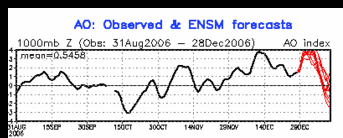
The GFS ensembles are coming into good agreement that the Arctic Oscillation will be falling as the first week of January progresses.

Image

The December 26 run was a little more ragged but the late trend was down.

Given historic experience with super long-duration AO+ regimes, things remain on course for the AO to go negative in the 1/10-20 timeframe. Afterward, the tendency for blocking will be increased if historic experience is relevant.

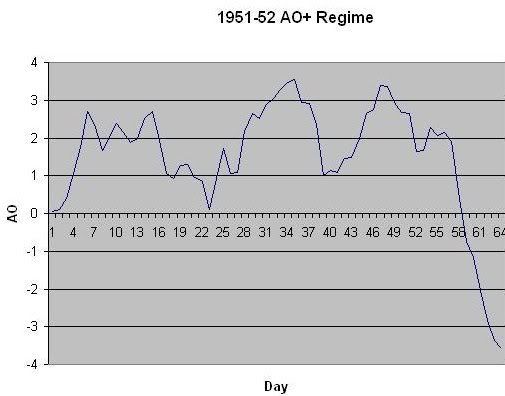
Third, even powerful AO+ regimes can collapse rapidly toward the end. The record-setting 1951-52 58-day AO+ regime offers a case in point.

Image

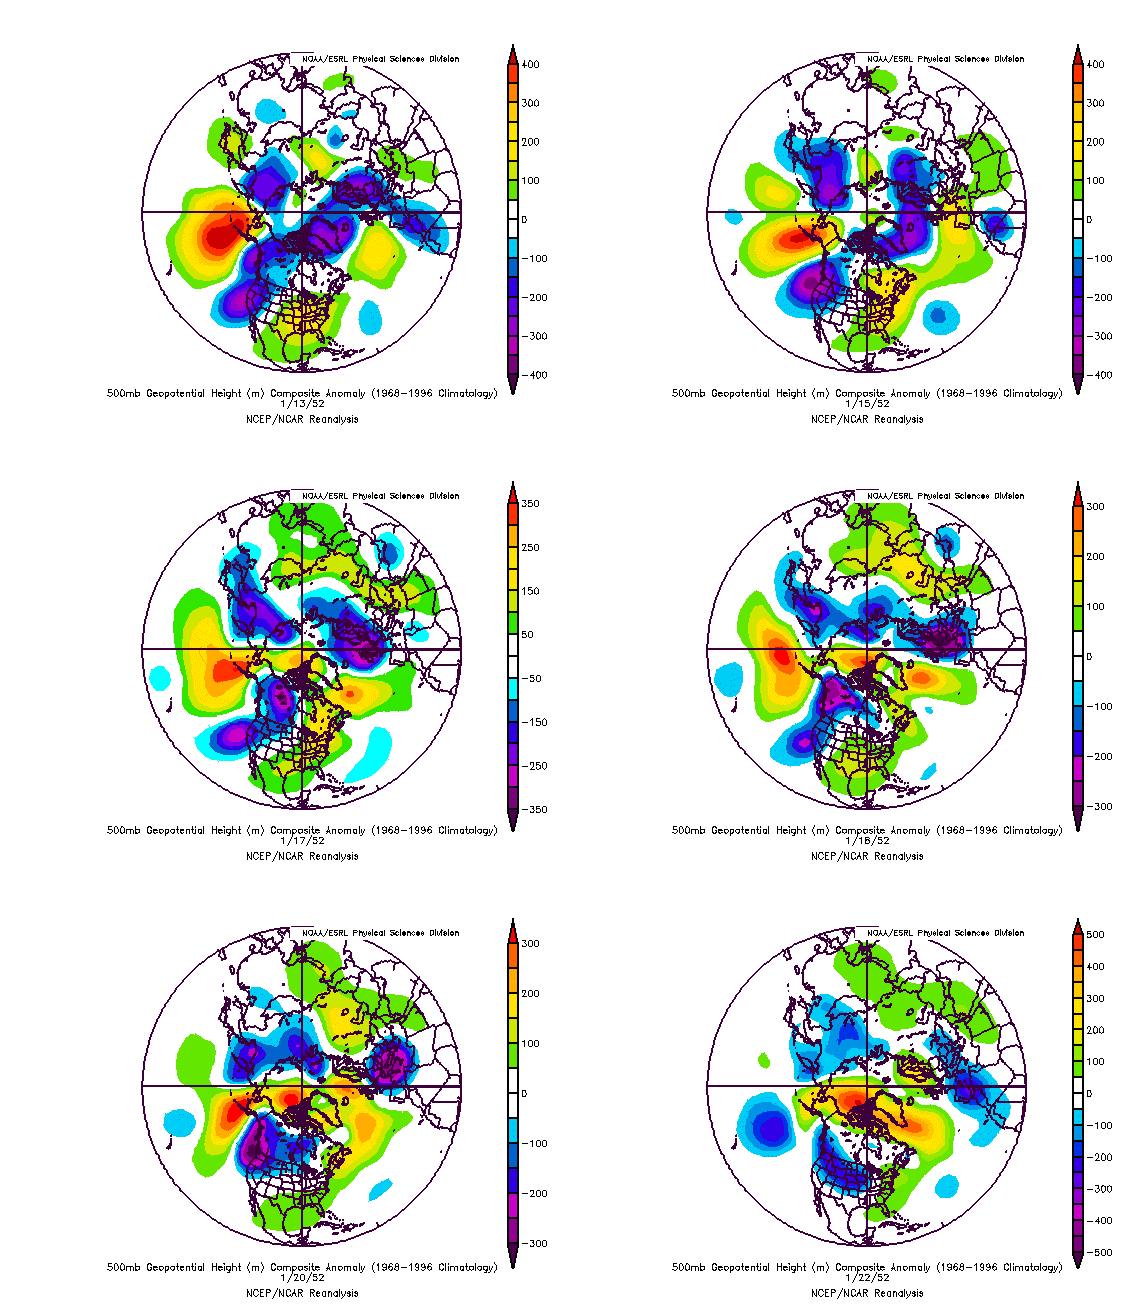
The following is the data and dramatic changes in the 500 mb pattern that took place in the January 13-22, 1952 timeframe:

Arctic Oscillation:
1/13 +2.270
1/14 +2.068
1/15 +2.134
1/16 +1.909
1/17 +0.399
1/18 -0.753
1/19 -1.161
1/20 -2.028
1/21 -2.844
1/22 -3.306

Image

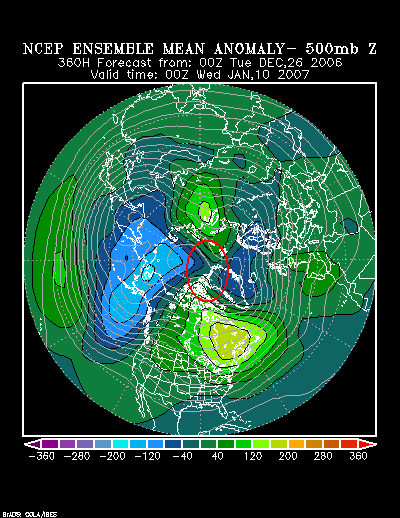
In 1951-52, the polar vortex eventually split and then the AO crashed. The latest NCEP ensemble 500 mb height anomalies now forecast that the huge polar vortex that has maintained the current AO+ regime may be poised to split in a fashion not too dissimilar to how the 1951-52 AO+ regime ended. This new information also lends confidence in the idea of a change to negative in the January 10-20 timeframe, which is a key assumption as far as a pattern change in that timeframe is concerned.

NCEP Ensemble 500 mb height anomalies at 264 hours:
Image

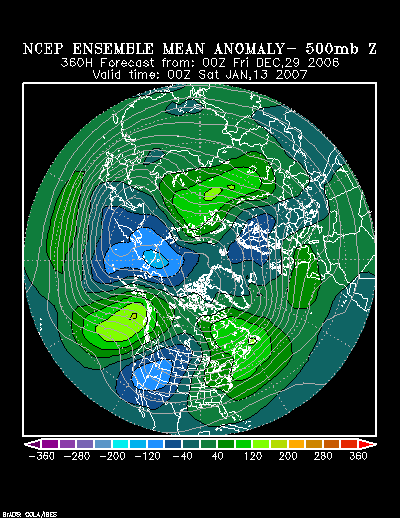
NCEP Ensemble 500 mb height anomalies at 360 hours:
Image

In the end, at least at this point in time, I have little reason to abandon my belief that a pattern change in the 1/10-20 timeframe is likely. The idea of a quicker evolution of events is something that I have not supported, so the fact that the NCEP ensemble suite is showing a blowtorch in that earlier timeframe is no reason for me to be discouraged. Moreover, it's something I had speculated about a few days ago, so things still appear to be proceeding in a fashion that gives me a measure of confidence that my general thinking may be on course.

For some, the 12/25 0z GFS was too much to bear. To quote John Milton, they've concluded, "Thus repuls’d [their dreams of an early pattern change to colder weather], our final hope Is flat despair." For me, I borrow from Shakespeare and maintain "A high hope for a low AO" down the road that will bring Winter 2006-07 to life. The latest forecast for the AO gives me reason to hold firmly to that hope.
0 likes   

MiamiensisWx

#24 Postby MiamiensisWx » Tue Dec 26, 2006 7:41 pm

Excellent analysis and nice follow-up, Don!

I believe your current thoughts on the possible AO pattern change via retrogression beyond the next several weeks seems in sync nicely with the vulnerabilities in the current Pacific pattern as well as the entering stratospheric warming event that's continuing. The combined factors with the current stratospheric warming trend slowly working down to the lower levels may eventually prove to be the kicker for the weakening of the polar vortex and potential split, allowing a slowly turning neutral or negative AO - and even possibly NAO - to kick in. It's possible that the current "ugly" Pacific pattern could in fact bode to be an aid in the potential pattern change via the current Pacific flow downstream. While this flow is progressive, it can aid in establishing proper dynamics for a more negative AO and/or NAO to slowly take place near Greenland as the stratospheric warming and polar vortex split eventually takes place down the road.
0 likes   

donsutherland1
S2K Analyst
S2K Analyst
Posts: 2718
Joined: Mon Sep 15, 2003 8:49 pm
Location: New York

#25 Postby donsutherland1 » Wed Dec 27, 2006 10:26 am

Evidence for a regime change in the AO is continuing to mount. The NCEP ensembles continue to show a splitting of the vortex. The GFS ensembles are in good agreement for a falling AO during the first week in January. By early January, the ECMWF is forecasting that warmer than normal readings near the North Pole will have descended to around 7.5 mb.

As the perpetual AO+ regime of 2006-07 finally falls apart in the January 10-20, 2007 timeframe, historic evidence suggests that one piece will head to western or northern Europe. The other larger piece could either languish near its current position or move slowly toward Asia. The latest run of the NCEP ensembles forecasts that it will slowly drift toward Asia. The 12/23 run of the GSM also may have hinted at such a prospect given its forecast temperature anomalies.

At the same time, the latest NCEP ensembles suggest that the development of a strongly negative NAO will probably not coincide with the demise of the AO+ regime.

If the above holds true, readings will merely trend to normal with occasional periods of somewhat below normal cold following the fall of the AO+ regime. More significant cold in which one or more days could see readings fall below 15° in New York City and Philadelphia might not reach the East for 10-14 days after the AO flips to negative. As a result, January will likely average warmer than normal in the East. ENSO climatology and past increased blockiness following the collapse of super long-duration AO+ regimes suggest that February would have the best chance to finish cooler than normal in the eastern half of the United States.

Although it might sound like heresy, I believe the slow development of a negative NAO rather than a crashing NAO might actually be a good development this time around. If the NAO were to crash immediately even as the largest piece of the once formidable polar vortex headed for Asia, the negative NAO would only be able to lock in place anomalously warm air that now covers much of Canada. In time, under such a scenario, a deep trough would be carved in the East, but readings would not turn severely cold. Once the block fell apart and the trough departed, a new blowtorch could then reignite.

Winter 2001-02 provides a lesson. Although my invoking this horrid season may conjure the worst of sentiments, the lesson is an important one for illustrating my point that the slow development of blocking is probably better than an immediate tanking of the NAO.

In December 2001, a 27-day NAO+ regime that saw the NAO exceed +3 on several days ended abruptly on December 13. The NAO tanked. By December 16 the NAO had fallen below -3. Two days later, it stood below -4. All said, during the 15-day period ended December 30, 2001, the NAO averaged -3.714. At the same time, the PNA rose sharply. During the 10-day period ended January 1, 2002, the PNA averaged +2.949.
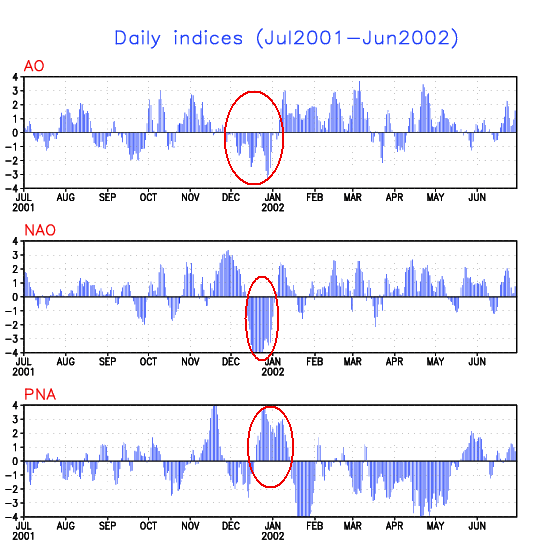
Image

In response to the dramatic blocking that developed, a trough reached California on December 20, weakened in the southern Plains on December 22, then rapidly amplified beginning on December 23 as it moved eastward. During the December 26-January 3 period, the East was covered by a deep trough.

Image

Temperatures averaged colder than normal, especially from the Mid-Atlantic region southward.
Image

Readings were not extreme. Select data for mean temperature, highest temperature, and lowest temperature follow for select cities.

Atlanta:
Mean: 35.8°
Highest: 62°
Lowest: 22°

Boston:
Mean: 30.7°
Highest: 39°
Lowest: 23°

Burlington:
Mean: 24.6°
Highest: 33°
Lowest: 15°

New York City:
Mean: 30.3°
Highest: 41°
Lowest: 20°

Philadelphia:
Mean: 30.1°
Highest: 44°
Lowest: 20°

Richmond:
Mean: 31.3°
Highest: 58°
Lowest: 17°

Washington, DC (DCA):
Mean: 31.4°
Highest: 47°
Lowest: 20°

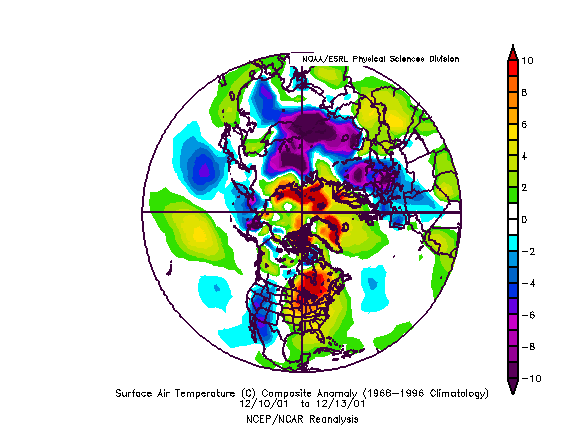
What happened was that Canada was filled with exceptionally warm air. Most of the cold air was located on the other side of the North Pole.

December 10-13, 2001 Temperature Anomalies:
Image

As the NAO was plunging, much of Canada was covered by readings of 10° or more above normal. On December 20, such anomalous warmth was centered mainly from the Hudson Bay/James Bay eastward. By December 23, much of Canada was again covered by such warmth. Hence, when the deep trough developed in response to the extreme block, only modest cold occurred. The colder air, though not extreme, swept across Lakes Erie and Ontario and created a historic lake effect snowstorm in the December 24-28, 2001 timeframe. Buffalo was buried under 82.3” of snow.

By January 3, 2002, another area of excessive warmth began building in western Canada. By January 6, much of Canada and the northern United States was again covered by much above normal temperatures. Later in January following the fading of another negative NAO event and collapse of the PNA to levels as low as -5.502, extreme warmth developed in the East.

Highest readings in the January 26-February 1, 2002 timeframe included:
Atlanta: 78°
Boston: 65°
Burlington: 51°
New York City: 69°
Philadelphia: 72°
Richmond: 81°
Washington, DC (DCA): 77° (two days)

January 2002 proved warmer than normal across much of the United States:
Image

Afterward, tsunamis of warmth periodically swept across the United States. Winter 2001-02 proved very warm, as a whole.

Image

As a result, seasonal snowfall wound up much below normal.

Albany: 47.4”
Baltimore: 2.3”
Boston: 15.1”
Burlington: 56.2”
Chicago: 31.1”
Montreal: 68.3” (173.2 cm)
New York City: 3.5”
Philadelphia: 4.0”
Providence: 11.6”
Toronto: 29.9” (76.0 cm)
Washington, DC:
…DCA: 3.2”
…IAD: 2.6”
Worcester: 43.6”

Conclusion:
In sum, I remain on board for a pattern change in the January 10-20 timeframe and the absence of strong blocking at the time the pattern change takes place is not necessarily a bad thing. The gradual development of blocking will allow time for colder air to begin filling Canada, so the outcome could differ from the nightmare of Winter 2001-02.

All said, I am not writing it off the pattern change nor am I canceling winter. Once the pattern change takes place, readings will likely return to near normal levels with possible somewhat cooler-than-normal days from time to time. Compared to the recent warmth, that will seem more frigid than it really is.

February could average cooler than normal in the East per increased blockiness and ENSO climatology. This would represent a dramatic change from Winter 2001-02, in which waves of warmth continued to regularly sweep the U.S. and Canada. As a result, there remains a prospect of snowfall winding up closer to normal than the hideous 2001-02 levels (except for Buffalo, which enjoyed a feast mainly on account of a single historic LES event).
0 likes   

User avatar
CaptinCrunch
S2K Supporter
S2K Supporter
Posts: 8728
Age: 57
Joined: Mon Nov 03, 2003 4:33 pm
Location: Kennedale, TX (Tarrant Co.)

#26 Postby CaptinCrunch » Wed Dec 27, 2006 10:54 am

While the East continues to be above normal we here in NTX are enjoying the normal to below normal temps and rain!! :ggreen:

NWS FTW TX

UPPER LOW OVER CENTRAL PLAINS WILL BE SLOW TO EXIT...BUT NORTH
TEXAS WILL BE IN DRY WESTERLY/NORTHWESTERLY FLOW REGIME. AS A
RESULT...POPS WILL BE LOW...BUT REINFORCING SHOTS OF COLD AIR WILL
KEEP TEMPS NEAR OR BELOW NORMAL THROUGH THE EXTENDED FORECAST.

Last edited by CaptinCrunch on Wed Dec 27, 2006 12:27 pm, edited 1 time in total.
0 likes   

User avatar
Janie2006
Category 5
Category 5
Posts: 1329
Joined: Mon Sep 18, 2006 3:28 pm
Location: coastal Ms aka home of the hurricanes

#27 Postby Janie2006 » Wed Dec 27, 2006 11:52 am

Interesting. I've always appreciated your insightful analyses, Don.

Would you say that (for this winter at least) a gradual "incremental" trend of the -NAO is much better than a single event in which the NAO plummets to -3/-4 and quickly recovers? Would such an incremental trend tend to indicate a pattern in which you might have a stronger blocking pattern later down the road? Or am I far off base here?

Even the outlying models seem to indicate an artic oscillation of only around -1 sometime after the New Year, rather than an event in which everything simply crashes.
0 likes   

donsutherland1
S2K Analyst
S2K Analyst
Posts: 2718
Joined: Mon Sep 15, 2003 8:49 pm
Location: New York

#28 Postby donsutherland1 » Wed Dec 27, 2006 8:30 pm

Janie2006,

Thanks for the kind words. In the upcoming situation, a slower descent in the NAO is probably better, as it will take some time for Canada to fill with cold air. If the NAO were to crash now, there wouldn't be much very cold air with which to work. Hence, the cooldown would be modest. Once the NAO rose, things would warm quickly. Winter 2001-02 provided perhaps the best illustration of an underperforming severely negative NAO. Canada was simply too warm, so the cold proved unexceptional.

Best wishes.
0 likes   

donsutherland1
S2K Analyst
S2K Analyst
Posts: 2718
Joined: Mon Sep 15, 2003 8:49 pm
Location: New York

#29 Postby donsutherland1 » Thu Dec 28, 2006 12:41 pm

The latest ensemble forecast for the Arctic Oscillation shows an even steeper dive than anytime recently.

Image

As noted previously in this thread, even powerful AO+ regimes can collapse rapidly toward the end. The record-setting 1951-52 58-day AO+ regime offers a case in point.

Image

The following is the data and dramatic changes in the 500 mb pattern that took place in the January 13-22, 1952 timeframe:

Arctic Oscillation:
1/13 +2.270
1/14 +2.068
1/15 +2.134
1/16 +1.909
1/17 +0.399
1/18 -0.753
1/19 -1.161
1/20 -2.028
1/21 -2.844
1/22 -3.306

In addition, there is some guidance suggesting that the EPO could also go negative down the road. All said, the proverbial footsteps of a coming January 10-20, 2007 pattern change appear to be drawing closer.
0 likes   

User avatar
Portastorm
Storm2k Moderator
Storm2k Moderator
Posts: 9914
Age: 63
Joined: Fri Jul 11, 2003 9:16 am
Location: Round Rock, TX
Contact:

#30 Postby Portastorm » Thu Dec 28, 2006 1:17 pm

Don,

While those of us in drought-stricken areas of Texas are welcoming the steady stream of El Nino systems and their replenishing rainfall. We also would welcome some colder, winterlike temperatures. Your news is good news as far as I'm concerned!

As always, thank you for your great posts!!
0 likes   

User avatar
wx247
S2K Supporter
S2K Supporter
Posts: 14279
Age: 41
Joined: Wed Feb 05, 2003 10:35 pm
Location: Monett, Missouri
Contact:

#31 Postby wx247 » Thu Dec 28, 2006 1:46 pm

So much for those folks who wanted to throw in the towel. Excellent analysis Don as always. :)
0 likes   
Personal Forecast Disclaimer:
The posts in this forum are NOT official forecast and should not be used as such. They are just the opinion of the poster and may or may not be backed by sound meteorological data. They are NOT endorsed by any professional institution or storm2k.org. For official information, please refer to the NHC and NWS products.

JBG
Tropical Storm
Tropical Storm
Posts: 146
Joined: Fri Apr 29, 2005 12:34 pm
Location: New York City area
Contact:

#32 Postby JBG » Fri Dec 29, 2006 1:13 am

wx247 wrote:So much for those folks who wanted to throw in the towel. Excellent analysis Don as always. :)

Time will tell.

Was 2001-2 second only to 1972-3 in lack of Northeast snow?
0 likes   

donsutherland1
S2K Analyst
S2K Analyst
Posts: 2718
Joined: Mon Sep 15, 2003 8:49 pm
Location: New York

#33 Postby donsutherland1 » Fri Dec 29, 2006 9:52 am

In another indication that the long-awaited pattern change will be underway in the January 10-20 timeframe, an area of colder than normal air is shown on the latest ensemble means at 360 hours.

Image

However, one should not assume that it will translate into an Arctic blast for the East. It will probably come east and reach the East Coast near January 15 +/- 2 days and bring a shot of meaningful cold. Nonetheless, if historic experience holds up, its lowest temperatures probably won’t fall below 15° in either New York City or Philadelphia. The following snippet from earlier in this thread sums up this situation reasonably well:

...readings will merely trend to normal with occasional periods of somewhat below normal cold following the fall of the AO+ regime. More significant cold in which one or more days could see readings fall below 15° in New York City and Philadelphia might not reach the East for 10-14 days after the AO flips to negative.

Having said this, a temperature regime that is closer to normal will begin to be established in the East. There remains a chance at one additional blowtorch effort before February. However, if such a situation arises, it will likely be brief. As the month advances, the synoptic framework for more sustained and significant cold will continue to evolve.

Whether or not a prolonged blocking episode, rather than frequent blockiness, will evolve remains to be seen. However, the 360-hour map of the NCEP ensemble 500 mb height anomalies contains a look that has sometimes transitioned into an extended period of blockiness.

Image

Here’s how such a situation has evolved in the past:

• An area of above to much above normal height of anomalies has moved off North America in the vicinity of Newfoundland (sometimes slowly, but sometimes more quickly).
• 2-4 days later that area was centered south of Iceland.
• 2-4 days later that area grew elongated (sometimes stretching from Europe to or across much of North America i.e., January 1958 and February 1962)
• From that it either continued to head for Europe where it often transitioned into a Scandanavian block that then retrograded or took a “short-cut” toward Iceland and from there retrograded.

During this evolution of events, one saw the area of above normal height anomalies periodically go through pulses of amplification and de-amplification. Later, the block remained in a semi-permanent position. In 1958, that block was largely centered in the vicinity of the Davis Strait from where it drifted, sometimes to the Hudson Bay area. In 1962, the block reached Scandanavia then very slowly retrograded across Greenland to the Davis Strait. That process consumed 6 days after the a 12-day “elongated” phase. Afterward, it took up a semi-permanent residence in the vicinity of the Davis Strait, while drifting somewhat as happened in 1958.

At this time the NCEP ensemble means offer a hint that one will eventually see the area of above normal height anomalies move slowly off eastern North America and then head for a position to the south of Iceland. What happens after could determine just how cold February might wind up, especially if cross-polar flow becomes established.

In the meantime, however, this situation winds up, I’m fairly confident that one will see the East wind up cooler than normal in February on account of frequent and moderate blockiness. There will some chance that a more extended and possibly deeper blocking regime sets up, but I’ll err on the side of conservatism and hold off on that idea until I see evidence for it. Nevertheless, I’m quite confident that the likely evolution of events will preclude a nightmare recurrence of a Winter 2001-02-type situation. So, look for at least some areas that have suffered a snow dearth to rally toward figures that might come close to normal by the time Winter 2006-07 ends. Some areas might not reach normal, but they likely won't witness a 1972-73, 1997-98, or 2001-02-style snow drought either.
0 likes   

cpdaman
Category 5
Category 5
Posts: 3131
Joined: Sat Jun 10, 2006 11:44 am
Location: SPB county (gulf stream)

#34 Postby cpdaman » Fri Dec 29, 2006 2:23 pm

so in years where boston has a warm november and less than 5 inches of snow in december, the most snow they had received in a season was roughly 25 inches.


i would have thought there was a lot of seasons when boston had less than 5 inches of snow in december and finished above normal, but i guess not after a warm november. hmmm this seems like a record that is destined to fall.

anyway i live in florida now, so no snow here at least in west palm beach.

(just north of orlando had snow flurries in late nov this year!)
0 likes   

donsutherland1
S2K Analyst
S2K Analyst
Posts: 2718
Joined: Mon Sep 15, 2003 8:49 pm
Location: New York

#35 Postby donsutherland1 » Fri Dec 29, 2006 2:54 pm

Cpdaman,

I pasted the wrong maximum figure for Boston. The maximum in such a situation was 44.7" in Winter 1957-58. I regret the error.
0 likes   

lwg8tr01
Tropical Wave
Tropical Wave
Posts: 4
Joined: Mon Dec 11, 2006 7:12 am

Finally a pattern change

#36 Postby lwg8tr01 » Fri Dec 29, 2006 5:14 pm

Don I see some signs, real concrete ones of a AO- coming on. Here in Pittsburgh we had about 1" ..yes that's one inch of snow so far. The old timers here say that when we have a warm December it's a cold January and Feb., anecdotal but they have also lived through the 60+ inch winters here too. I hoping the GFS and EURO continue to show a breakdown of this dreadful pattern we have been in. Warmistas retreat to the shadows.
0 likes   

donsutherland1
S2K Analyst
S2K Analyst
Posts: 2718
Joined: Mon Sep 15, 2003 8:49 pm
Location: New York

#37 Postby donsutherland1 » Sat Dec 30, 2006 4:46 pm

Earlier in this thread, I noted:

As the perpetual AO+ regime of 2006-07 finally falls apart in the January 10-20, 2007 timeframe, historic evidence suggests that one piece will head to western or northern Europe. The other larger piece could either languish near its current position or move slowly toward Asia. The latest run of the NCEP ensembles forecasts that it will slowly drift toward Asia. The 12/23 run of the GSM also may have hinted at such a prospect given its forecast temperature anomalies.

The most recent ensemble guidance suggests that the major piece will, in fact, head for Asia. Another piece will be directed into Europe.

Image

Finally, it is showing a third piece breaking away from the largest area that goes to Asia and that piece will likely bring a decent outbreak of cold air (not severely cold but seasonal to perhaps somewhat below seasonal norms in the January 15 +/- 2 days timeframe).

So far, things remain well on course for a pattern change in the January 10-20 timeframe with readings trending toward normal along with some below normal days. More meaningful cold probably would not arrive until after.

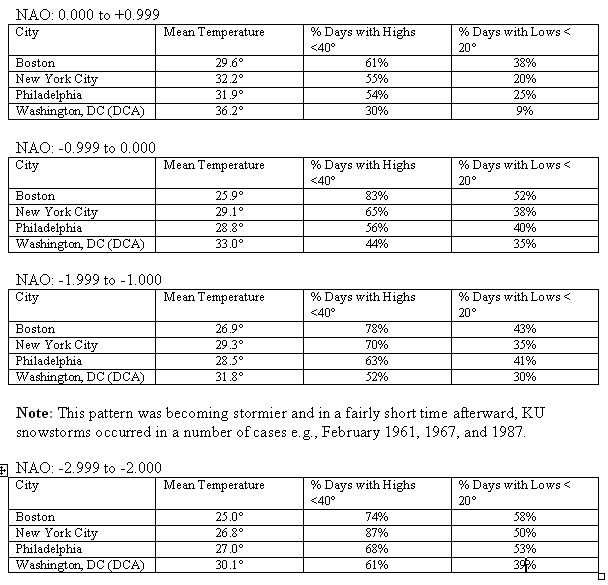
The development of blocking will play an important role in helping shape the development of sustained colder conditions. For an example, here is data for various NAO parameters when the PNA ranged from -1 to +1. This is not a forecast that I expect the PNA to remain in such a range. It is only an illustration of how the NAO can affect things.

Image

Finally, there is some ensemble support for a negative NAO down the road. Blockiness has typically grown more frequent following the collapse of super long-duration AO+ events. Whether or not prolonged and deeper blocking occurs remains to be seen. For now, the pattern change that will usher in the return of winter and lead to a snow "rally" that could bring seasonal figures toward normal by the time the winter is finished remains on track. I continue to believe that a 1972-78, 1997-98, or 2001-02 snow catastrophe--near absence of snowfall--is very unlikely how the pattern is evolving. This is based both on historic experience with similar evolutions and ENSO climatology.
0 likes   

JBG
Tropical Storm
Tropical Storm
Posts: 146
Joined: Fri Apr 29, 2005 12:34 pm
Location: New York City area
Contact:

#38 Postby JBG » Sat Dec 30, 2006 8:18 pm

donsutherland1 wrote:Earlier in this thread, I noted:
For now, the pattern change that will usher in the return of winter and lead to a snow "rally" that could bring seasonal figures toward normal by the time the winter is finished remains on track. I continue to believe that a 1972-73 (fixed typo in post), 1997-98, or 2001-02 snow catastrophe--near absence of snowfall--is very unlikely how the pattern is evolving. This is based both on historic experience with similar evolutions and ENSO climatology.


I can see how this differs from 1997-8 or 2001-2. In 1997-8 we had the Super El Nino; in 2001-2 we had NAO + straight through, with that momentary late December-mid-January "plunge" that allowed cold air to plunge from Siberia towards India, but by and large didn't affect the Western Hemisphere.

Two of the examples you give either provide no comfort or had different ENSO profiles. February 1967 was either ENSO neutral or had a mild La Niña; February 1987 was, for the NYC area, a snow drought month.

1972-3 is a bit more troubling. We had, in the New York area, plenty of cold weather in October (earliest snow ever, and hauntingly similar to this fall's burying of Buffalo in October), major November 15 and December 15 blizzards that narrowly missed the NYC area, but plastered everything from Danbury on north, and biting cold waves (a few days with highs under 20) in the first half of January, and spread through late January into February. And yet only 2.9 inches of snow in Central Park.

The ENSO looks similar to this winter; moderate El Niño during a cold PDO phase. How does this scenario/outlook differ?
0 likes   

donsutherland1
S2K Analyst
S2K Analyst
Posts: 2718
Joined: Mon Sep 15, 2003 8:49 pm
Location: New York

#39 Postby donsutherland1 » Sat Dec 30, 2006 10:27 pm

JBG,

For one thing, there was virtually no blocking from late January until near mid-March in 1972-73. That does not appear likely this time around.
0 likes   

bob rulz
Category 5
Category 5
Posts: 1704
Age: 35
Joined: Sat Jan 28, 2006 7:30 pm
Location: Salt Lake City, Utah

#40 Postby bob rulz » Sun Dec 31, 2006 6:35 am

What kind of affect does this look to have on the western United States?
0 likes   


Return to “Winter Weather”

Who is online

Users browsing this forum: No registered users and 4 guests